statistical significance, hypothesis testing, p-value, multiple hypothesis testing
Of Carrots and Horses and the Fear of Heights
Janez Demšar
Sep 29, 2019
A word of warning. When teaching in the US, I am careful enough to not say things like "consider a binary variable, for instance, gender". But I'm writing this from Russia where considering gender as a binary variable is not only an acceptable but rather a desired, official position. In Russia you can even get away with some mild swearing. While I never use strong curse words, neither in the classroom nor in private, I occasionally say "shit", which is, as I have been warned, not acceptable in US classrooms (while on corridors you can f... all you want). This blog entry targets Russian audience.
A(n imaginary) friend of mine has this hobby of searching for all kinds of weird relations. Basically to annoy people, and me in particular. Like "you know, I discovered that people who wear glasses tend to like horses". Yes, sure they do. "No, seriously, I collected some data. One hundred people, actually. See? It's totally scientific." Like hell it is. "Prove me wrong then!" he said. Pathetic.
One day I've had enough and built a BS-detector, short for "bullshit detector". I invented a formula that computes the similarity between two columns of 0's and 1's. It's normalized so that it gives me a 1 if the columns are the same, a -1 if they are exactly opposite, and 0 if one tells us nothing about the other, that is, they are the same in exactly half of cases. The score can also be any other number in between, of course - the more different from 0, the stronger the relation. At first I called the formula "Demšar's bullshit score", but the next day it sounded too much like being about "Demšar's bullshit" rather than "bullshit score". So I made up a better name: "Pearson correlation coefficient". After watching all that Star Trek series featuring all kinds of "rotating field harmonics", I became rather proficient at inventing fancy names myself. Pearson correlation coefficient sounds really convincing.
When the imaginary friend (children need them for company and professors need them for making up stories) brought me his next relation, I computed the so-called "Pearson correlation coefficient", got a result of 0.012 and explained what it meant. In his concrete example it meant that drinking apple juice has nothing to do with fear of heights.
Of course he complained that 0.012 is not zero, but I was prepared for this. I already realized that the numbers I'll get for his relations won't be neither 0 nor 1. So I needed to get some intuition into what kind of numbers to expect from his random (to my belief) relations. I produced some random data myself. I pretended to have a sample of one hundred people for which I recorded two properties. Both binary. One may be a tendency to scratch head, and the other binary variable may be, for instance, gender. Except that I of course had no actual data and just made up two random columns of zeros and ones. And computed my formula.
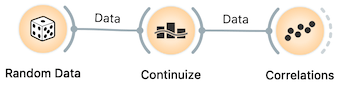
To do so, I opened Orange and created the following workflow. Widget Random Data from add-on "Orange3-Educational" provides random data drawn from different distributions. I set it up to prepare two variables drawn from Bernoulli distribution, which is a fancy name for a random column of 0's and 1's. The two variables are discrete, so I attached its output to Continuize to make them numeric. Widget Correlations computes the Demšar's ... I mean "Pearson correlation coefficient".
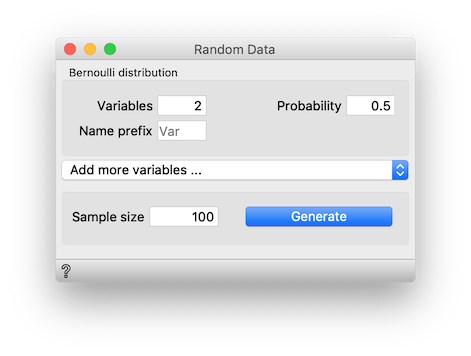
I checked the coefficient for my pair of random variables. It gave me 0.084, which is more than the score of his -- to his claim related -- pair, 0.012. I went back to Random Data, generated a different sample, and checked the correlation. And repeated it again. And again. Always larger than his 0.012. I told him that I can run this for 1000 times, but then I saw it's more practical to just construct 45 variables instead of 2 by changing parameter Variables in Random data to 45.
This gave me 990 pairs. A large majority of them was larger than 0.012 that he presented. Actually, I told him (after scrolling way down through the widget) that apple juice and fear of heights were so unrelated that 914 out of (almost) 1000 random relations were stronger than this.
I opened a beer about two minutes later, after closing the doors behind him. I earned it.
Next day he came again. And the next. And the following day, too. He just wouldn't give up. And I kept opening beers until his fifth day's relation indeed had a BS score of 0.22 (and luckily made some sense -- I indeed believe that women can distinguish between more colors than men, who recognize about six or seven). I argued that 0.22 is still low, but he forced me to look into my correlations and, damn, only 32 out of 1000 random relations were so strongly correlated. I had to yield this time: I confessed that random, uncorrelated variables were unlikely to give such strong BS scores.
We agreed that even some of 1000 random (non-)relations are bound to be related by chance, so I couldn't request that he beats all my random pairs. We decided that we will consider a relation significant, if its Pearson correlation coefficient is so large that only 5 % of random relations exceed it. With his samples of size 100, my experiments showed that this value was 0.204. So 5 % it was. I thought it safe enough, he thought it fair enough.
We now had a perfect test. One that we would both trust.
Nothing happened for a few days. I believed I essentially won. He knew that we had a method for detecting his bullshit so he won't bother me again (so soon and so often).
Or so I thought. Several days later some devil brought him again, with some more relations to check. Total rubbish, but some were really strong. Then he confessed he made up the data for those. It made no sense why he would do this -- and then even confess. But when I looked into the data I realized he was trying to guess my secret formula! By the looks of it, he actually succeeded. I made a stand: I made him swear he would never ever cheated by falsifed data. Ever. Again. Or it was the last time I talk with him.
A day passed. He came grinning so I knew something was up. Eating carrots helps against missing a bus. It has beaten all except the top 2% of my random relations.
So I opened a beer -- with him. After the second one he opened up. He actually thanked me for the formula! He said it makes his life so much easier. I realized that I haven't won but shot myself in the foot. He now uses my formula methodically. Yes, he actually calls it a method. He even gave it a name, he calls it "null-hypothesis significance testing". I didn't know he was a fellow Star Trek fan.
He collected a huge number of his stupid measurements over the years. All on the same group of one hundred individuals. He still believes that some variables are related. And I gave him a method for checking them. We agreed that any pair that beats at least 95% of my random pairs (for which it needs a score of 0.204) is truly correlated. So his method now is to simply compute my formula (which he knows under the name Pearson correlation coefficient) on all pairs of features. He picked one out of many pairs with correlation above 0.204 and brought it to me for testing. Hence the grin.
The worst thing was that he wasn't doing this (only) to tease me. He sincerely believed in the method. We agreed that this would be the way to test his relations and he was serious about it. If my formula gives the number above 0.204 for some relation, the relation is true.
He thanked for the beer and promised to come again tomorrow. And the day after, too. Now that we are collaborators.
Чёрт! (Another confession: I'm writing this at Patriarch ponds, sitting on a bench with my face towards the pond and my back towards Malaya bronnaya.)
I had some serious thinking to do.
Next day he came as promised. He told me about the latest relation he found. I forgot what it was; I didn't pay attention. Neither did I bother to check it -- because I knew he has. I instead asked him how many variables he has. Like, for every person he knows whether she or he smokes, wears socks at work, speaks any Hungarian, reads Russian grotesque novels ... how many different things? He said 154.
"Oh, this is quite a collection. Good work," I kept chatting while typing something into a calculator. "So you must have identified around 590 'statistically significant' relations in your list, haven't you?" He was significantly less happy after hearing this. "Actually 592," he said. "But -- how did you know?" "People with strange beards like mine tend to have telepathic abilities," I said seriosly. "What?" "Не шалю, никого не трогаю, починяю примус."
I hate spoilers and told him nothing. But I'll tell you. It's easy. We can rather safely assume that all his correlations are random. So we can replicate his data without actually collecting it. Open the Random data widget and generate 154 variables instead of 45, so that you simulate his data. Go to Correlations and check how many pairs of random variables have a correlation above 0.204. You'll see there are around 590. Quite close to the number he got.
But I wrote that I typed the numbers into a calculator. Sure. I don't need Orange for this. With 154 variables, there are 154 * 153 / 2 = 11781 pairs. We agreed that he can show me any relation that beats all but top 5 % of random relations. His relations are random so there are 11781 * 0.05 = 590 relations in the top 5 %.
The story of course follows the dogma of hypothesis testing. We test a relation by computing some statistics, like Pearson correlation coefficient, and compare it with the value of this statistics that we would get on random data of this kind. This can be done like here. We generate a great number of random cases and compute the statistics for each. If the tested hypothesis beats all except 3 % of random ones, we say p = 0.03, meaning that "there is only 3% probability that a randomly generated hypothesis would reach such a high score".
There is of course a faster way to test the significance of the Pearson correlation coefficient. Pearson was a smart guy (and my calling his correlation coefficient a "bullshit score" shouldn't be taken out of the context of the story). Distribution of Pearson correlations for random data is known, so critical values (like 0.204 in our case) can be computed analytically, without simulation. We nevertheless used the simulation in this story to make it more evident what significance testing actually does.
The story is not without flaws. The 11891 hypotheses are not unrelated. More importantly, when I wrote that the guy went home unhappy (though grudging), I implied that I proved the lack of correlation. With the common null-hypotheses testing you cannot prove the null-hypothesis (in my case: the hypothesis that there is no correlation). Applied properly, he wins if my test proves the correlation, or we call it a draw if it doesn't. I can't win.
The moral of the story is that statistical tests should not be used in the way we use them here. They are not a magic bullet for testing the correctness of hypotheses. There is not just one but two problems here.
If the test requires beating 95 % of my random relations, it will incorrectly recognize 5 % of relations as significant. This is pretty obvious: the top 5 % of my relations beat the remaining 95 %. His random relations will be equally successful, by pure chance. I knew the test was not failsafe. But he cheated: he checked all his relations and brought me those that passed the test. This is the skill of the Texas sharpshooter: shooting first, and drawing targets around holes next. He just found the relations that were successful by chance. For this reason, statistical hypothesis testing requires that you form the hypothesis first, and only then test it on the data - instead of forming them form the data, like he did.
But even if he wouldn't cheat and he would pick pairs at random, with 5 % threshold, 1 of 20 hypothesis would still be successful by chance, so he would be happy once every full moon, assuming he'd take weekends off. In statistics, this is called multiple hypotheses testing. You have to account for randomly "successful" hypotheses by using various corrections. Let us mention just the Bonferroni correction as the simplest example.
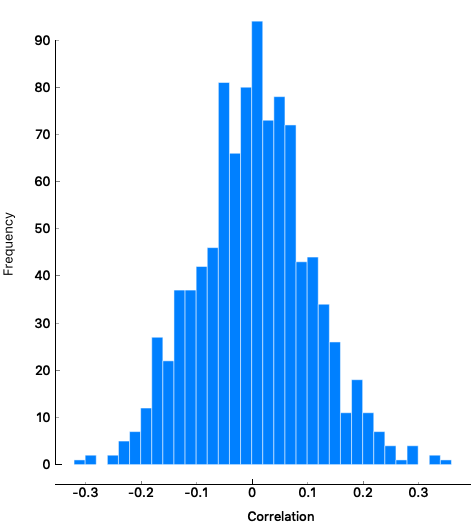
This being an Orange blog, let us conclude by showing a problem with (careless use of) Orange. Connect Distributions widget to Random data. A dialog will pop-up so you can decide which Correlation's output to use. Connect output "Correlations" to input "Data". Correlations now shows the distribution of Pearson correlation coefficients on this data. Correlation coefficient is significant if it's in the 5 % tail of this distribution. You can fit some curve to this if you wish.
 \
\
Now connect Sieve to Random data. Open it and click Score Combinations. It will order the pairs according to their significance. For every pair we select, Sieve will also show its chi-square and the corresponding p-value (at the bottom left). Predictably, the first 50 pairs have p-values below 0.05. By using Score Combinations and picking the top ones, we are making the same mistake as my imaginary friend. (Sieve does not compute Pearson coefficients but chi squares, yet in this context the two statistics are completely related. You can check that Correlations and VizRank show the same order of pairs.)
So using Score Combinations (or equivalent buttons in other widgets) and then claiming that you found and proved some relation, is exactly what my friend was doing.
Does this mean that we shouldn't use Score Combinations? Why does Orange have such buttons then? They are safe to use for as long as we do not consider relation that we found in this way as "proven". Automated tools for forming hypotheses can, well, form hypotheses. To prove them, you need to check them on another data (and still risk a 5 % chance of being successful by pure luck, if you use statistical tests and require p < 0.05) or, preferably, you should find the underlying reason for the correlation.
Eating a lot of carrots decreases the chances of missing a bus because being more like a rabbit helps you run faster.