Network Analysis
Statistical analysis of network data.
Inputs
- Network: An instance of Network Graph.
- Items: Properties of a network file.
Outputs
- Network: An instance of Network Graph with appended information.
- Items: New properties of a network file.
Network Analysis widget computes node-level and graph-level summary statistics for the network. It outputs a network with the new computed statistics and an extended item data table (node-level indices only).
####Graph level
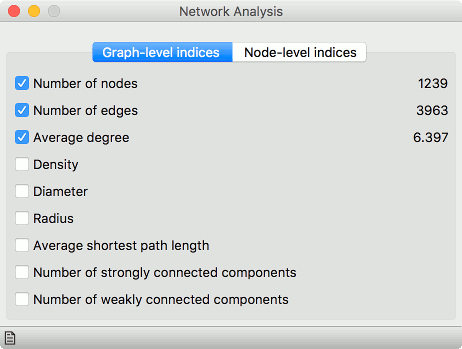
- Number of nodes: number of vertices in a network.
- Number of edges: number of connections in a network.
- Average degree: average number of connections per node.
- Density: ratio between actual number of edges and maximum number of edges (fully connected graph).
- Diameter: maximum eccentricity of the graph.
- Radius: minimum eccentricity of the graph.
- Average shortest path length: expected distance between two nodes in the graph.
- Number of strongly connected components: parts of network where every vertex is reachable from every other vertex (for directed graphs only).
- Number of weakly connected components: parts of network where replacing all of its directed edges with undirected edges produces a connected (undirected) graph (for directed graphs only).
####Node level
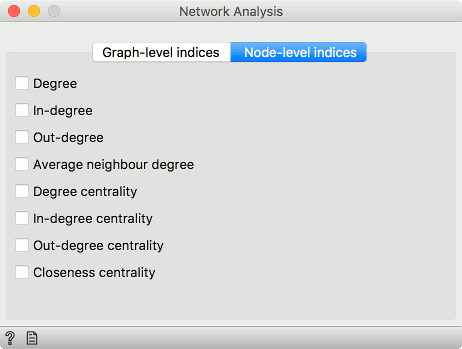
- Degree: number of edges per node.
- In-degree: number of incoming edges in a directed graph.
- Out-degree: number of outgoing edges in a directed graph.
- Average neighbor degree: average degree of neighboring nodes.
- Degree centrality: ratio of other nodes connected to the node.
- In-degree centrality: ratio of incoming edges to a node in a directed graph.
- Out-degree centrality: ratio of outgoing edges from a node in directed graph.
- Closeness centrality: distance to all other nodes.
Example
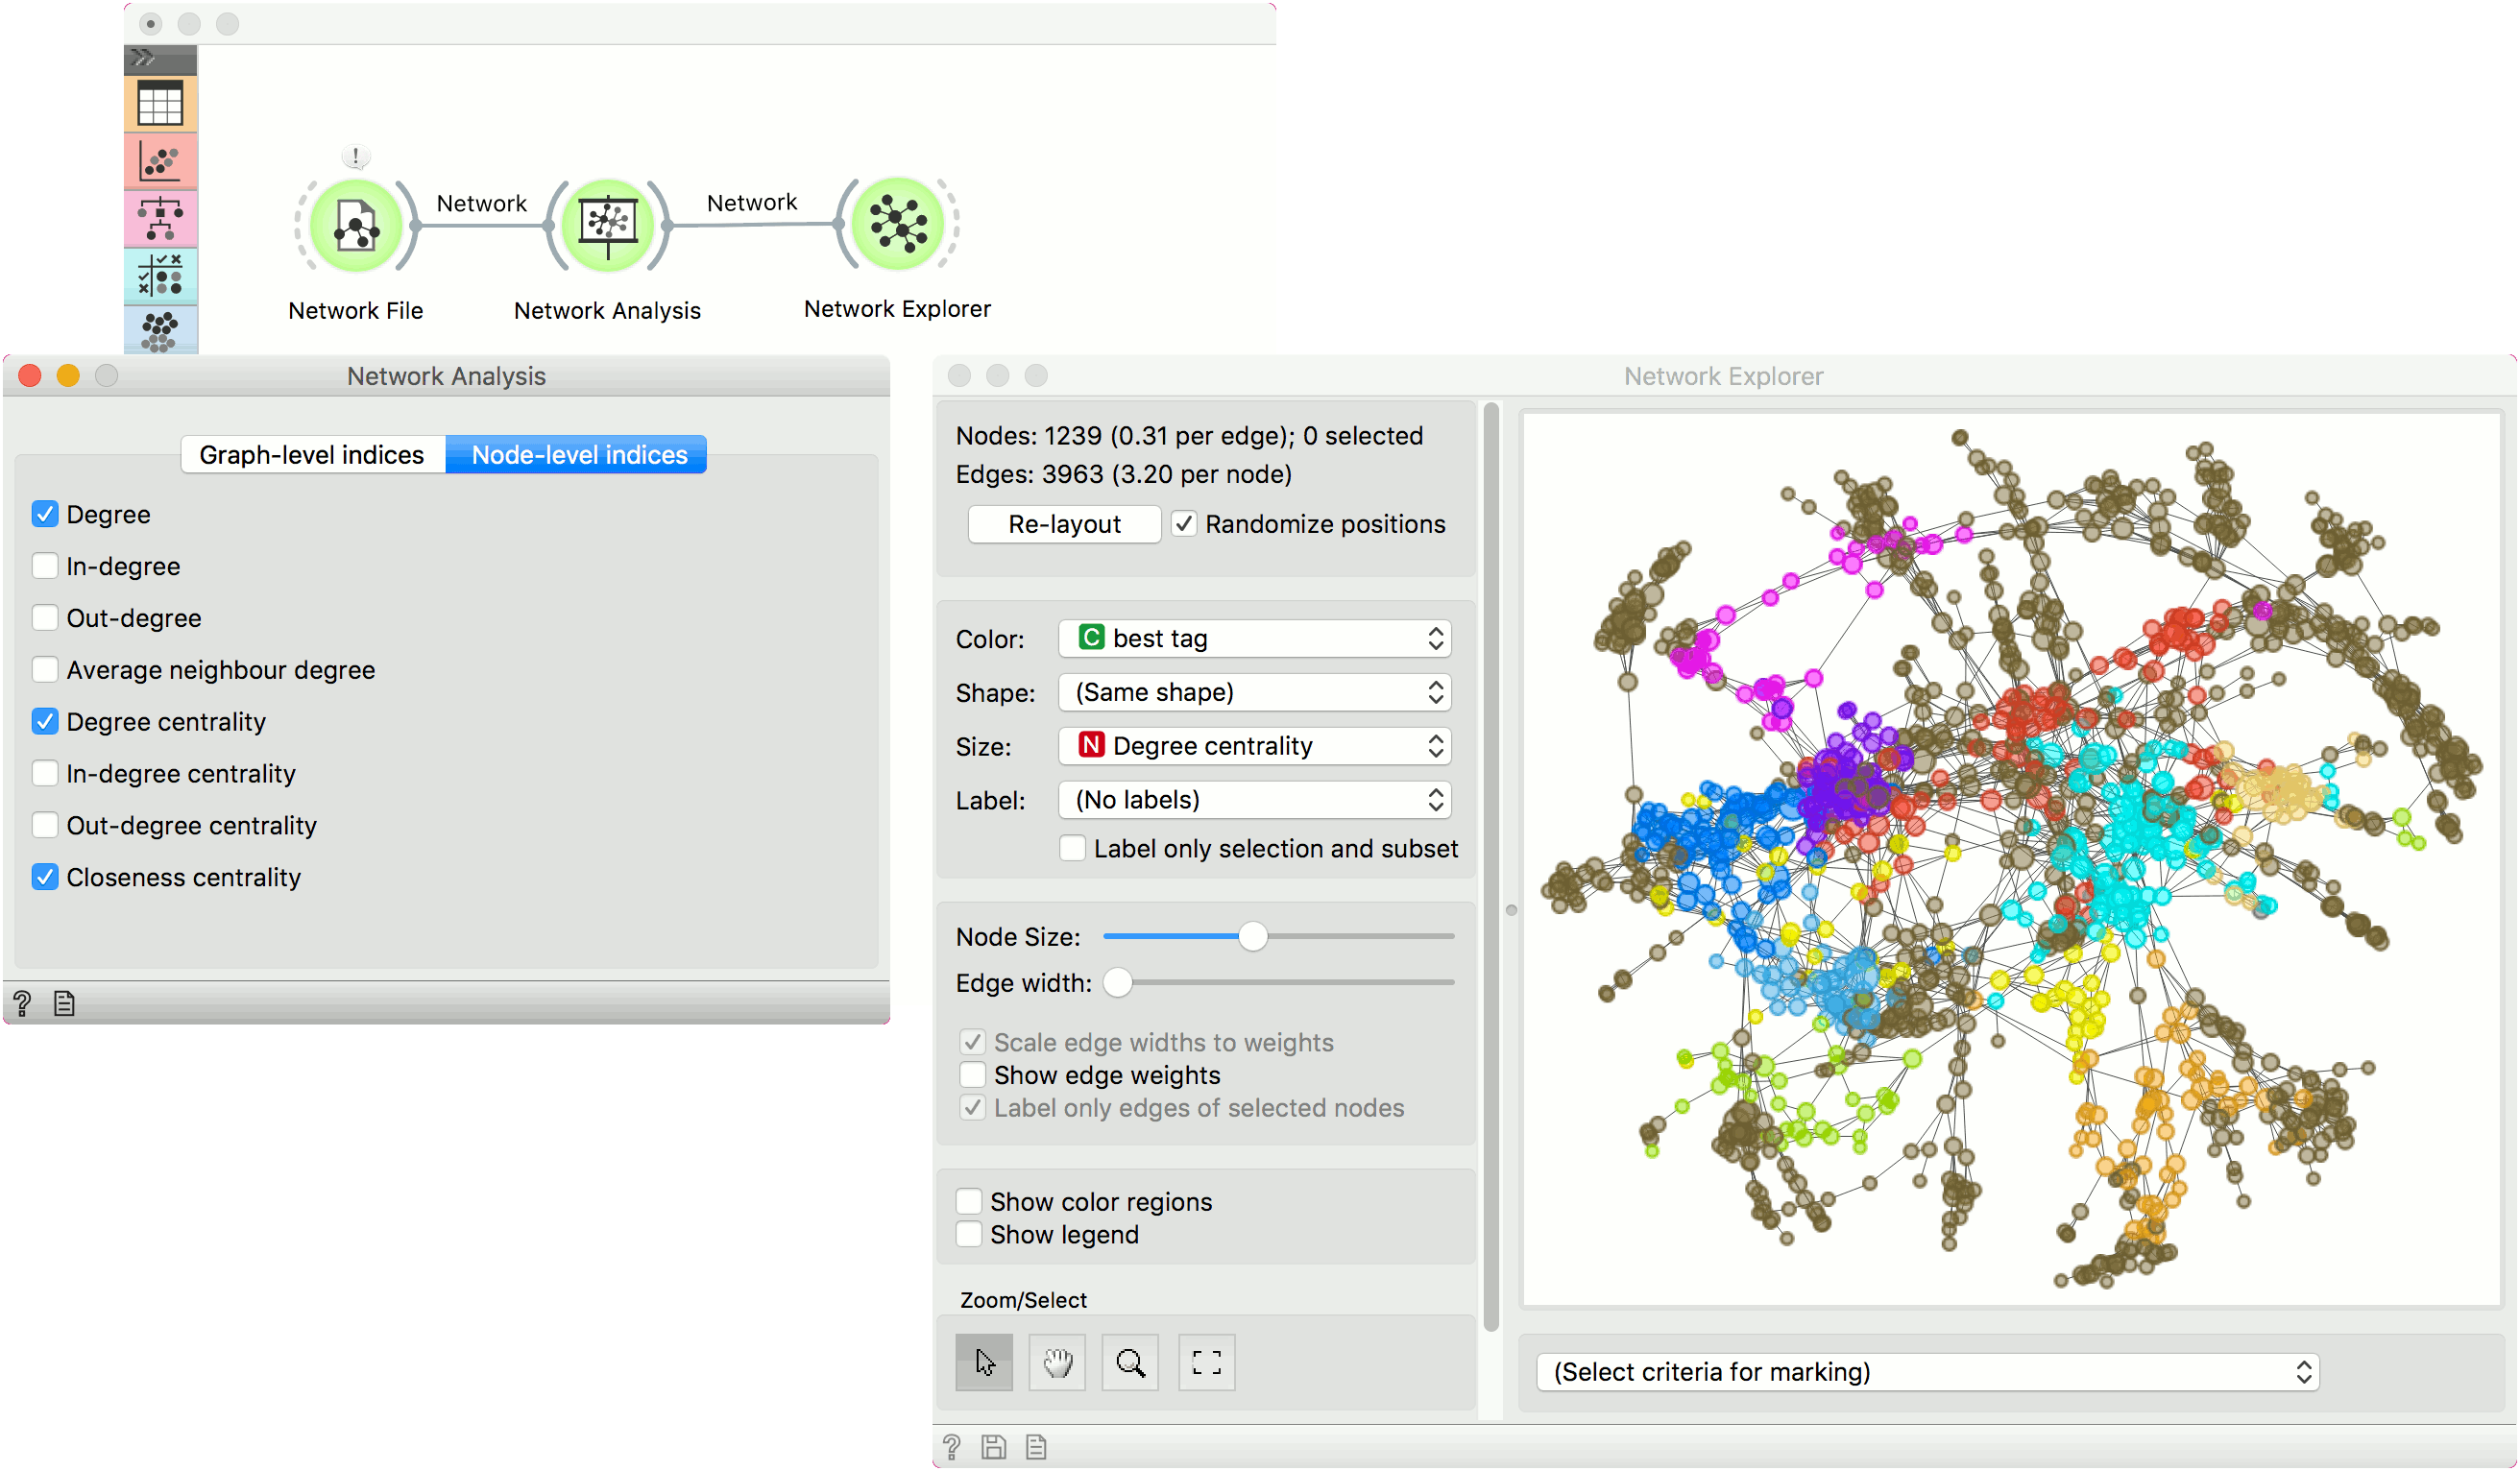
This simple example shows how Network Analysis can enrich the workflow. We have used lastfm.net as our input network from Network File and sent it to Network Analysis. We've decided to compute degree, degree centrality and closeness centrality at node level.
We can visualize the network in Network Explorer. In the widget we color by best tag, as is the default for this data set. But now we can also set the size of the nodes to correspond to the computed Degree centrality. This is a great way to visualize the properties of the network.