pivot table, aggregate, data, groupby
Aggregate, Group By and Pivot with... Pivot Table!
Ajda Pretnar
Aug 27, 2019
Orange recently welcomed its new Pivot Table widget, which offers functionalities for data aggregation, grouping and, well, pivot tables. The widget is a one-stop-shop for pandas' aggregate, groupby and pivot_table functions.
Let us see how to achieve these tasks in Orange. For all of the below examples we will be using the heart_disease.tab data.
pandas.DataFrame.agg
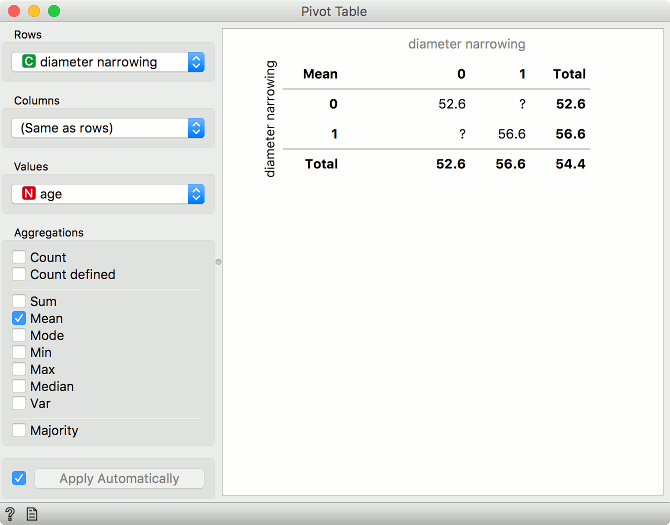
The first task is computing a simple mean for the column age.
>>>df['age'].agg('mean')
54.43894389438944
In Orange:
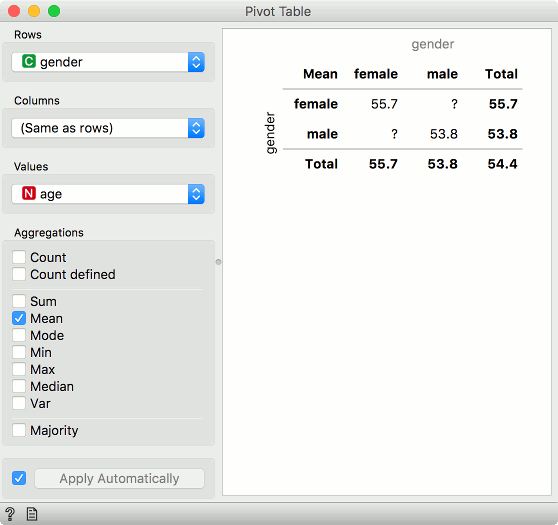
In Pivot Table we set Values to age and set aggregations to mean. There is no way to turn off splitting by rows in Pivot Table, but the values in Total report the mean value for the chosen attribute.
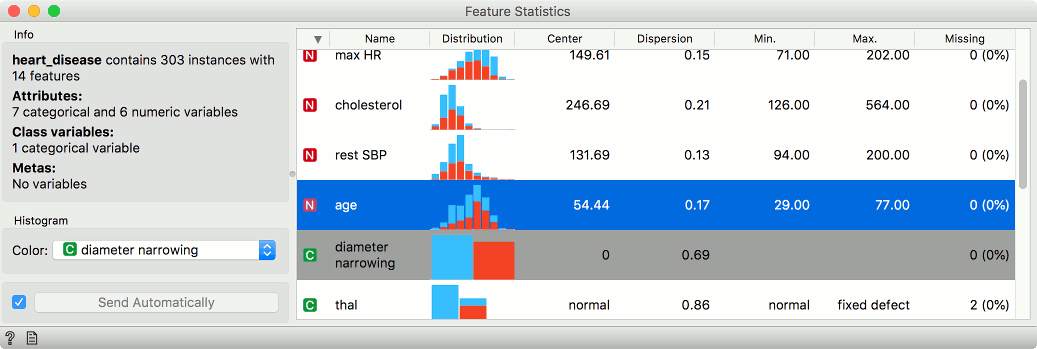
An even better way to observe simple statistics is in Feature Statistics widget. The widget also reports on the mean value of each attribute with handy distributions plots included.
Yet another way to observe a mean value is in a Box Plot.

pandas.DataFrame.groupby
The second task is grouping the data by a discrete column. Say we want to group by gender and report the mean value for each column.
>>> df.groupby(['gender']).mean()
              age    rest SBP   ...  ST by exer.  major ves. col.  diameter narrowing
gender
female  55.721649  133.340206   ...   0.867010    0.546392          0.257732
male    53.834951  130.912621   ...   1.120874    0.732673          0.553398

[2 rows x 9 columns]
In Orange:
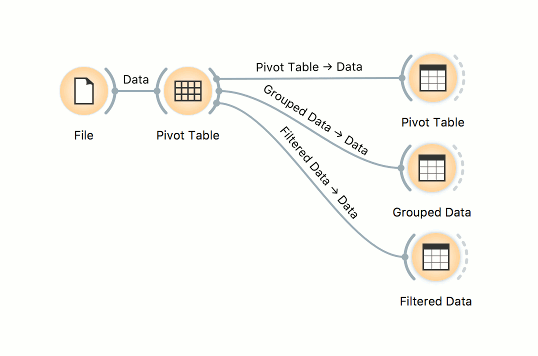
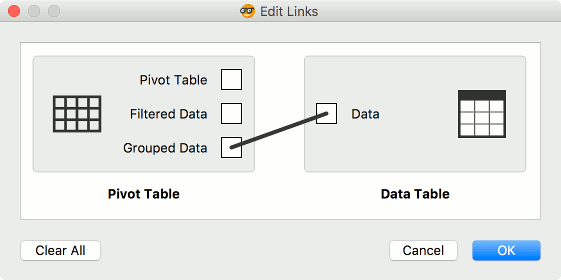
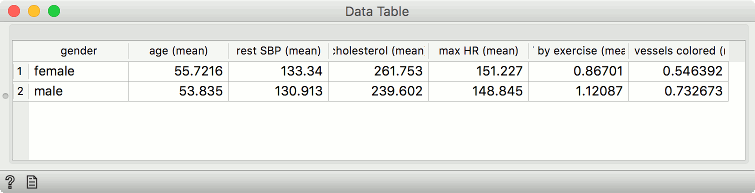
In Pivot Table set Rows to gender and aggregation method to mean. The Values option in this example has no effect. Now, connect Data Table to Pivot Table. Finally, reset the connections. Pivot Table outputs three types of data - Pivot Table, Filtered Data, and Grouped Data. The output we are looking for here is Grouped Data.
This is our data table. Exactly what we were looking for.
pandas.DataFrame.pivot_table
The third, final task is constructing a pivot table where rows are values of diameter narrowing, columns are values of gender and the values in cells is the mean of age for each subgroup. In other words, we want to see the average age of females with diameter narrowing, males with diameter narrowing, females without diameter narrowing and males without diameter narrowing.
>>> pd.pivot_table(df, values='age', index=['diameter narrowing'], columns=['gender'], aggfunc=np.mean)
gender                 female       male
diameter narrowing
0                   54.555556  51.043478
1                   59.080000  56.087719
In Orange:
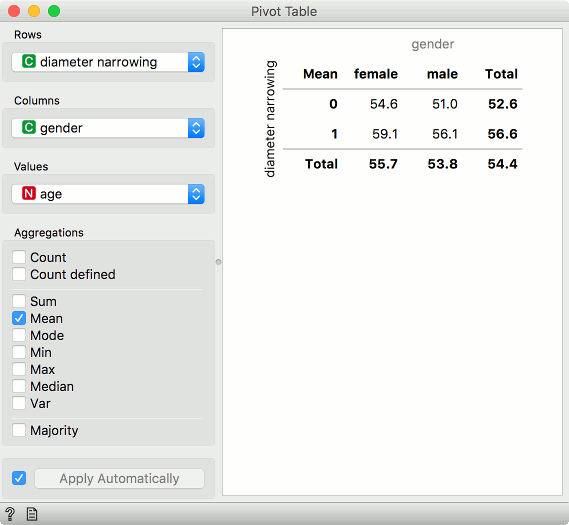
In Pivot Table set Rows to diameter narrowing, Columns to gender, Values to age and aggregation method to mean. The widget already offers a view of the final data table, but we can also output it and use it in other Orange widgets.
Pivot Table widget really versatile - like a Swiss knife for data transformation.