Blog
image, tutorials
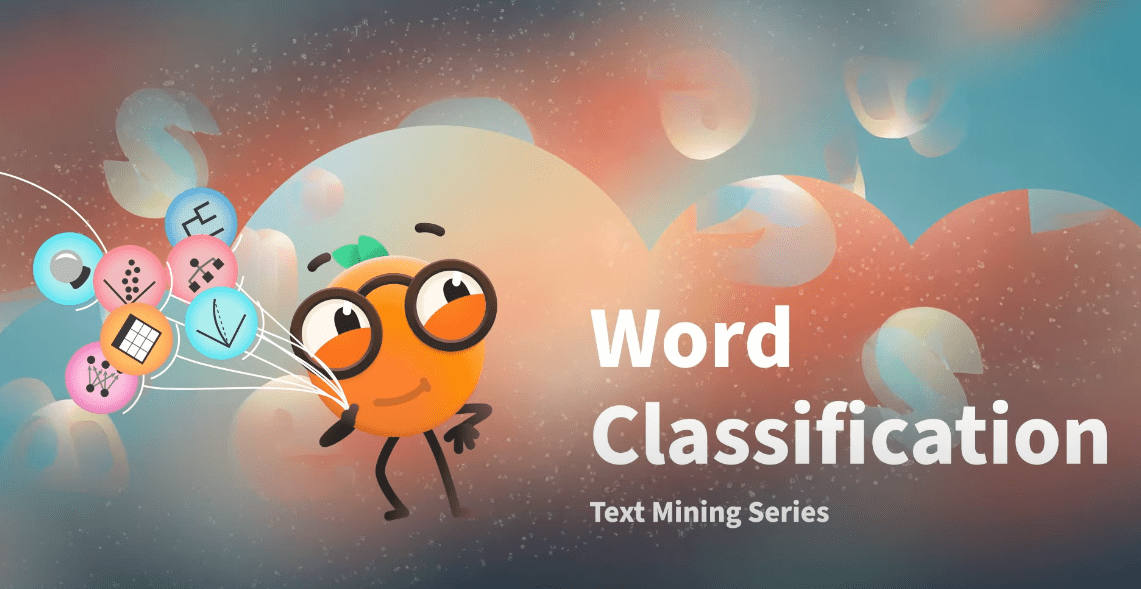
So Sweet and So Fresh … New Text Mining Tutorial is Out
A step-by-step guide on how to build a classifier to predict food types. Getting the know the widgets Test and Score, Logistic Regression, Confusion Matrix, Predictions.
Erika Funa, Apr 15, 2024
image, embedding
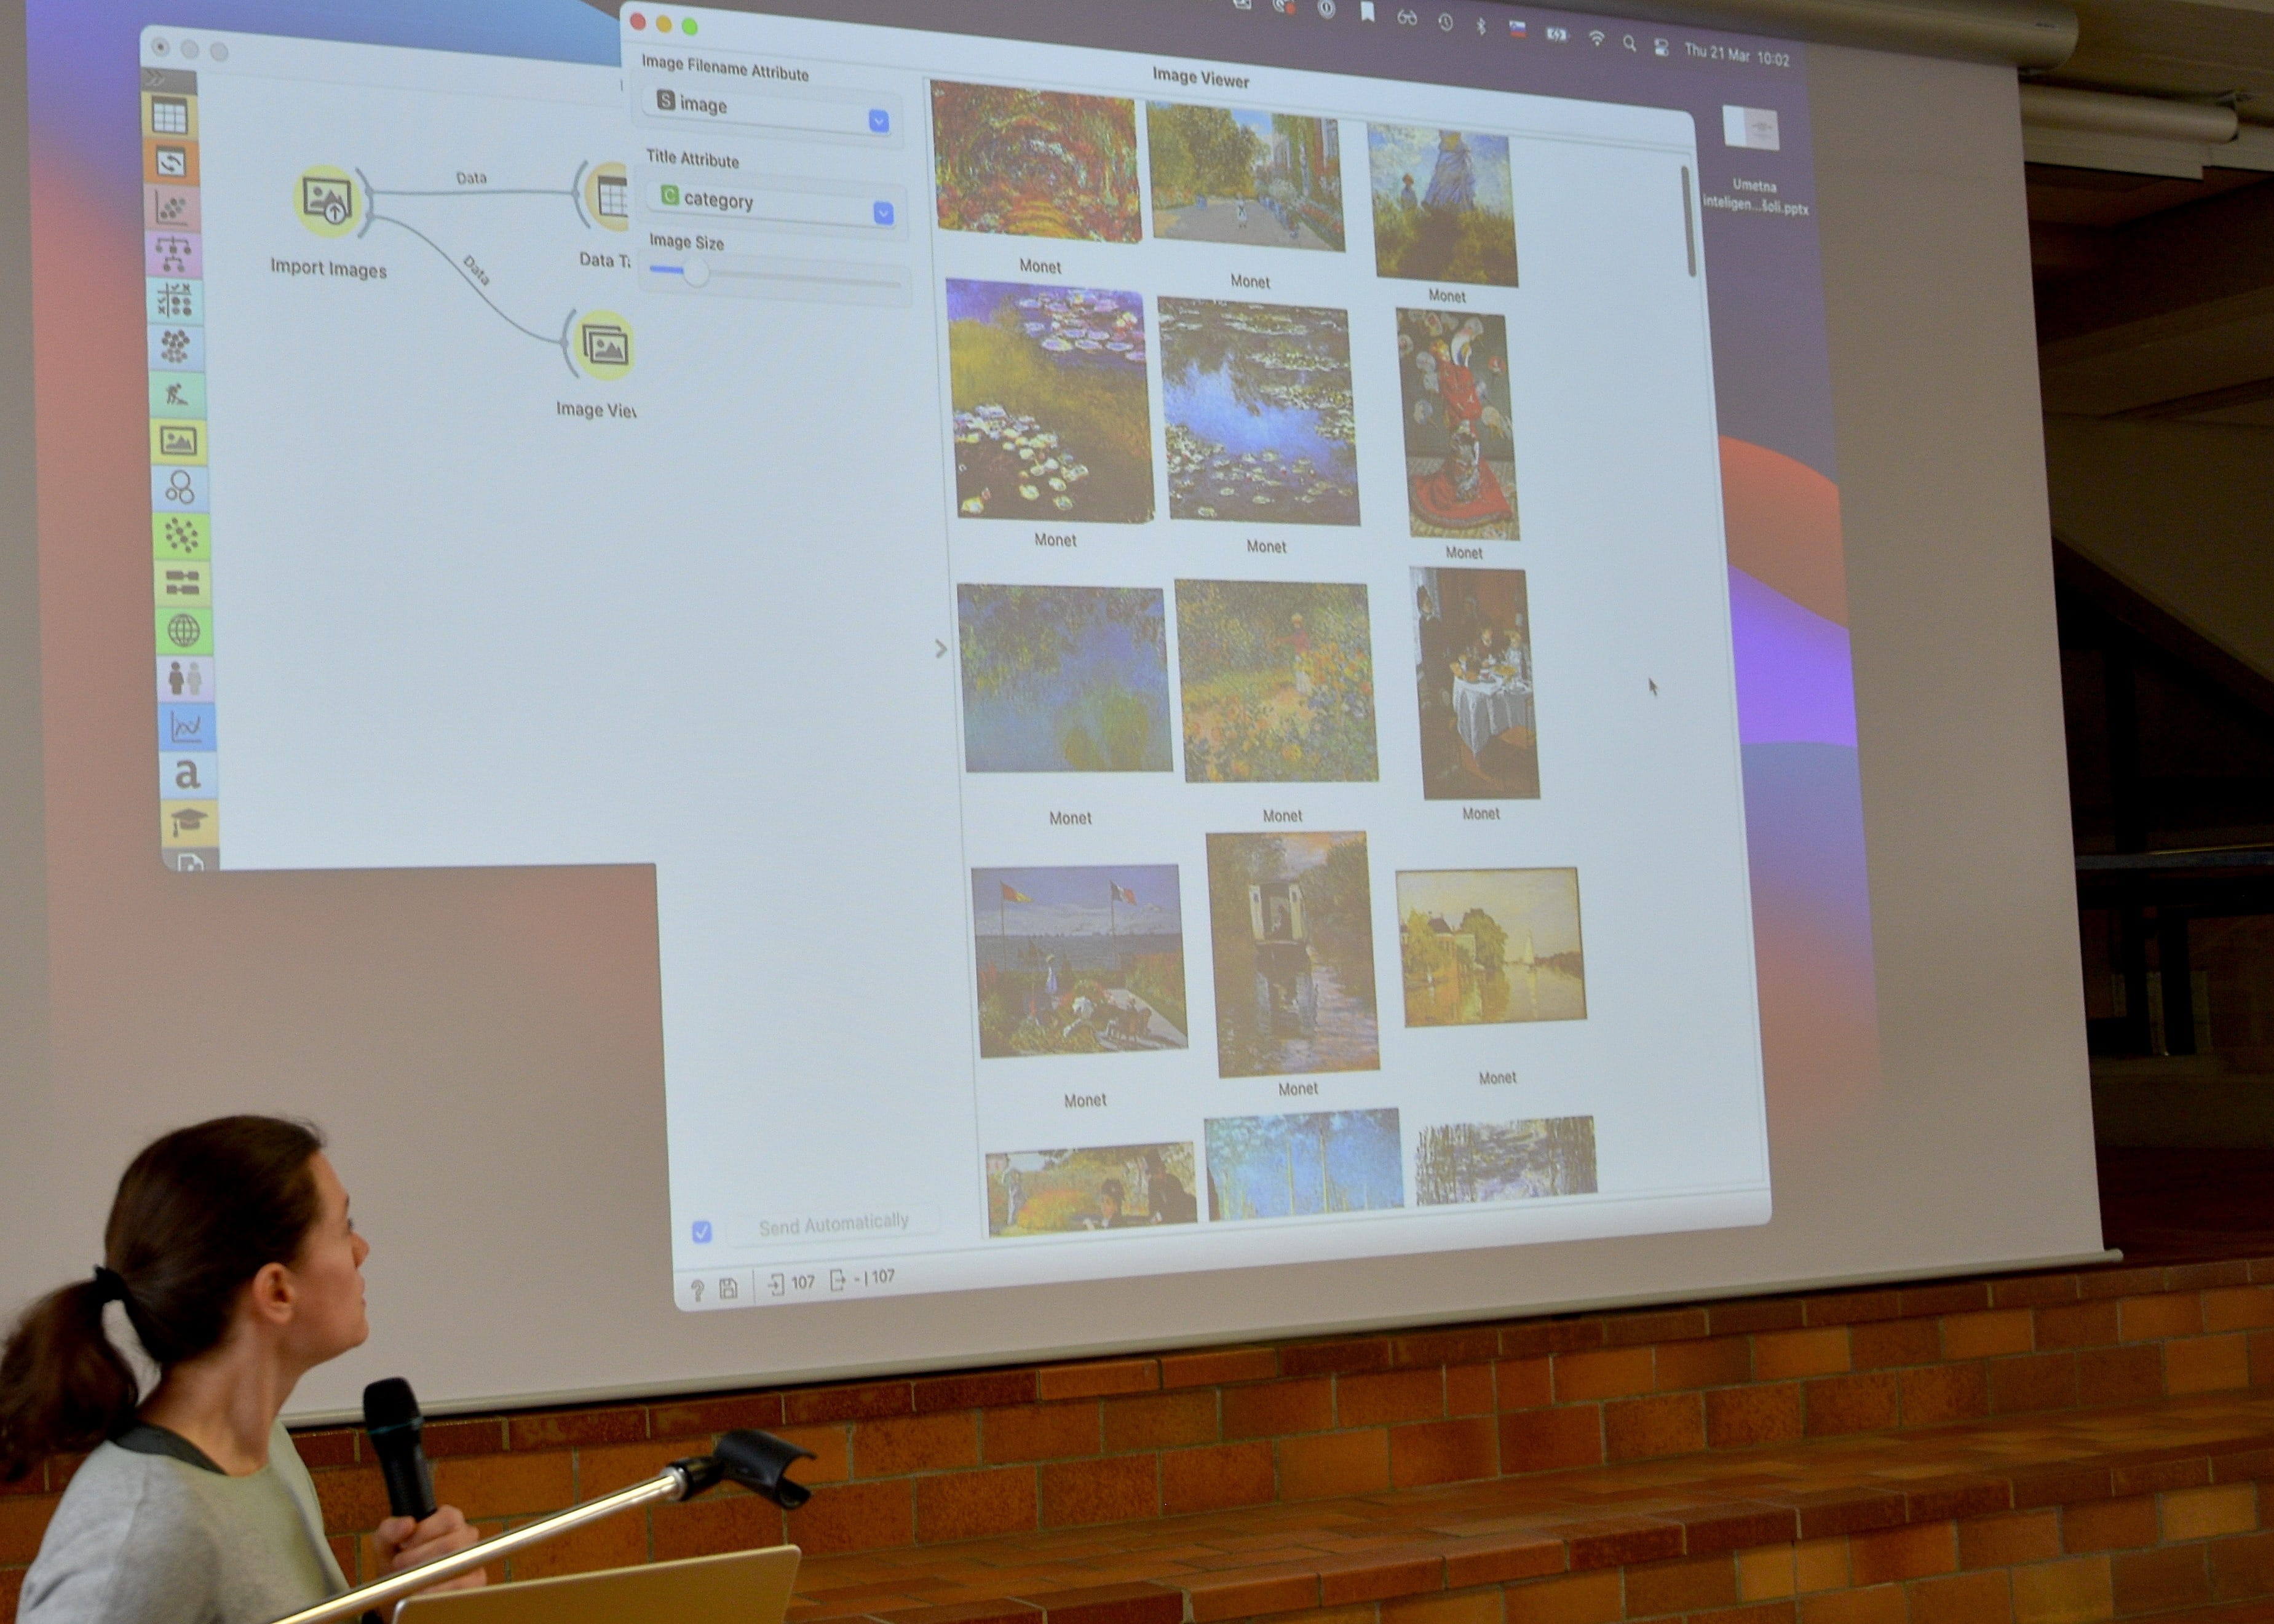
Orange put on its painter's hat for an image analytics workshop in Austria
Erika Funa, Apr 11, 2024
explain, prototypes, scoring sheet
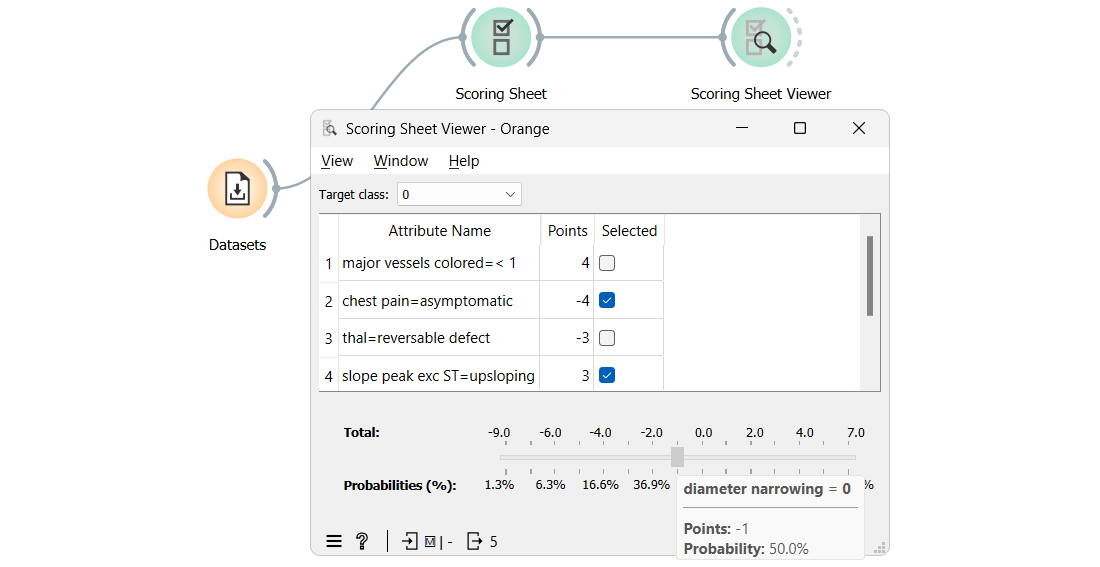
Scoring Sheets: Transform Data into Insightful Scores
Orange's Scoring Sheet widget provides explainable machine learning predictions using a simple scoring system. Each feature's influence obtains an integer score, making it easier to understand and communicate the model, crucial in sectors where transparency is vital.
Žan Mervič, Jan 11, 2024

text mining, images
Cookie Mining
A companion to our Orange Data Mining Holiday Special video on how we mined cookie descriptions and how to create cookie clustering.
Blaž Zupan, Dec 22, 2023

T-shirt, survival analysis, tutorial
Our Christmas Present: Free Orange T-Shirt!
Enroll in our survival analysis tutorial, and you might just unwrap a free Orange T-shirt along with a hefty dose of data science cheer!
Jaka Kokošar, Dec 20, 2023
dask, survival analysis
From Data Portals to Portals of Doom: Avoiding it with Dask
Circumvent the limitations of second-hand data portals: Orange with Dask enables you to process big data sets while ensuring the source's authenticity and enabling custom workflows.
Jaka Kokošar, Nov 08, 2023
dask, spectroscopy
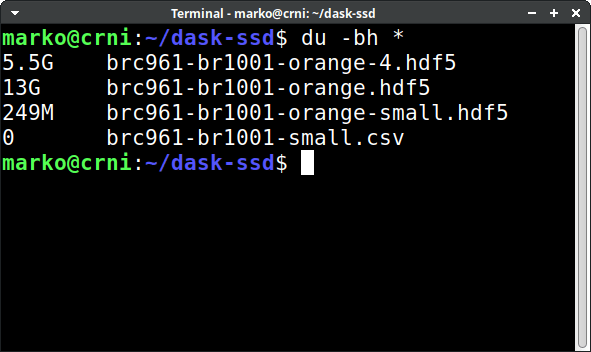
Can Orange explore a 13 GB data set?
An experimental version of Orange supports much larger data sets. It never loads the whole data set into the working memory; data is only processed in small chunks. We show a case study on a 13 GB spectroscopy data set.
Marko Toplak, Oct 28, 2023

dask, development
Dask all Folks: Preparing Large Datasets
Preparing large HDF5 datasets that load into Orange as on-disk data.
Noah Novšak, Oct 24, 2023
conference, research
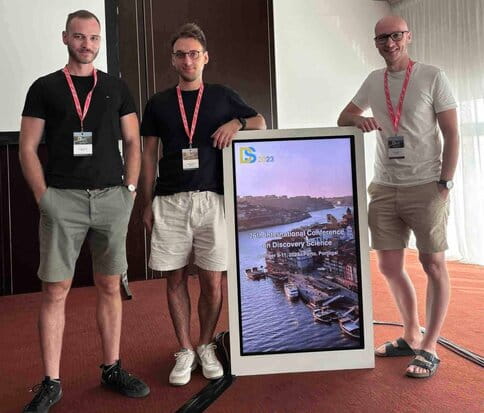
Recap of 26th International Conference on Discovery Science
Highlighting our papers from the International Conference on Discovery Science
Martin Špendl, Oct 20, 2023
update, video series
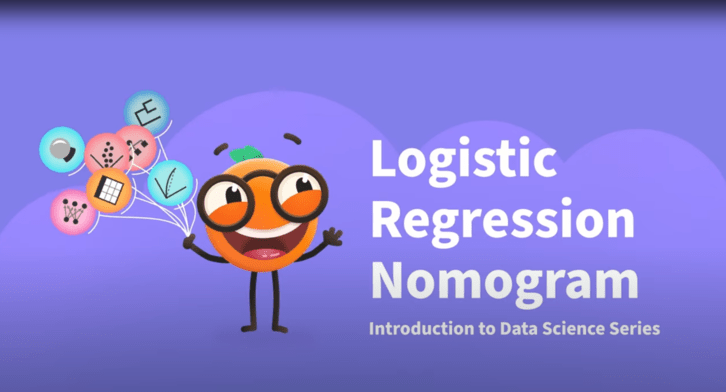
Fall Season Brings Fresh Content to the Introduction to Data Science Series
Updates in the Introduction to Data Science Video Series, new video logistic regression nomogram.
Erika Funa, Oct 17, 2023
fairness
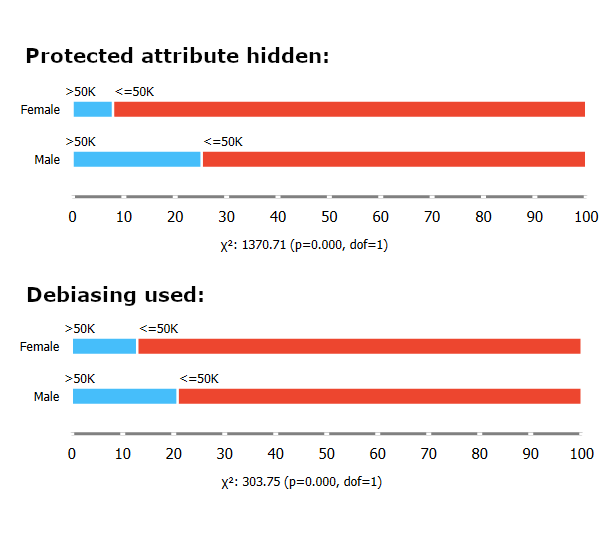
Why Removing Features Isn't Enough
Find out why merely removing protected attributes will not fix bias. Features often correlate, letting models infer biases. Fairness algorithms are key for genuine bias mitigation.
Žan Mervič, Sep 19, 2023
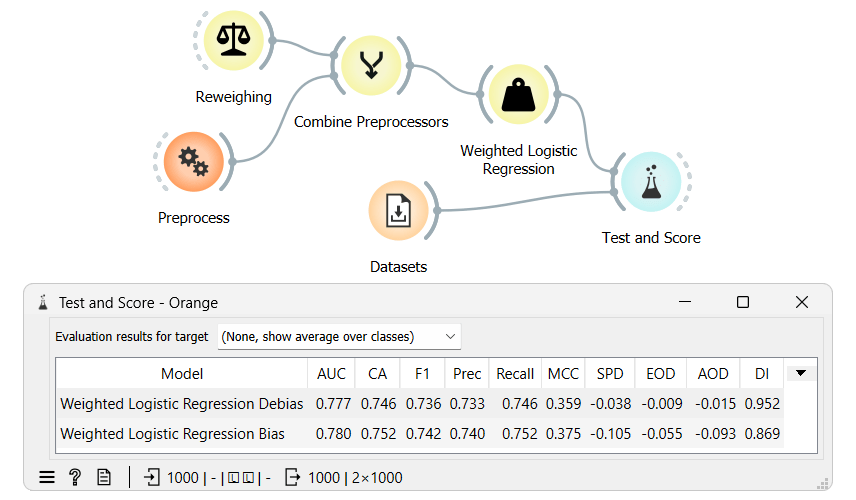
fairness, reweighing
Orange Fairness - Reweighing as a preprocessor
Expanding on the Orange fairness Reweighing widget: using it as a preprocessor and integrating new fairness scoring metrics.
Žan Mervič, Sep 19, 2023
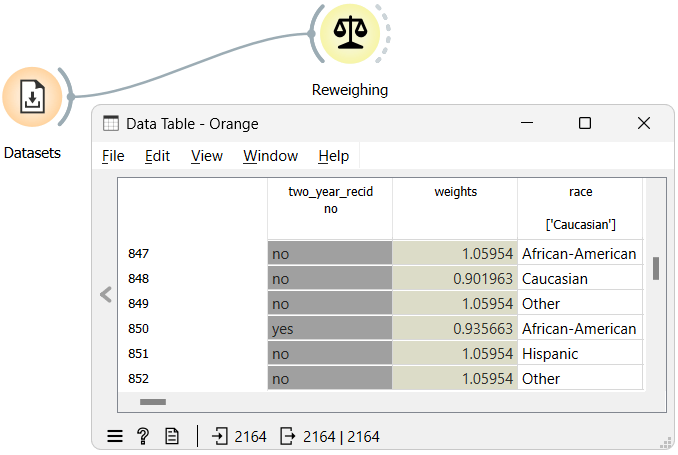
fairness, reweighing
Orange Fairness - Reweighing a Dataset
Introducing the Reweighing widget in Orange, a solution for dataset bias mitigation.
Žan Mervič, Sep 19, 2023