Screenshots
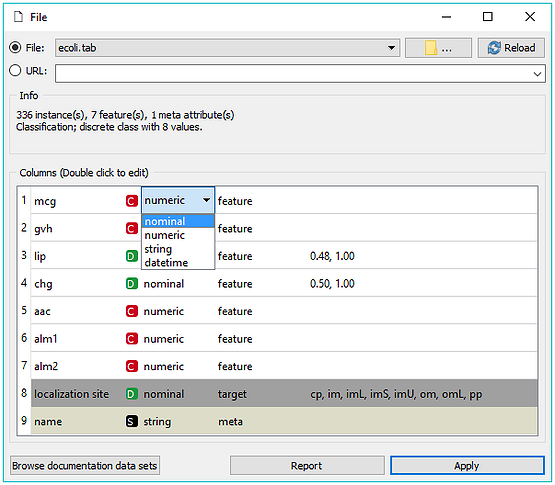
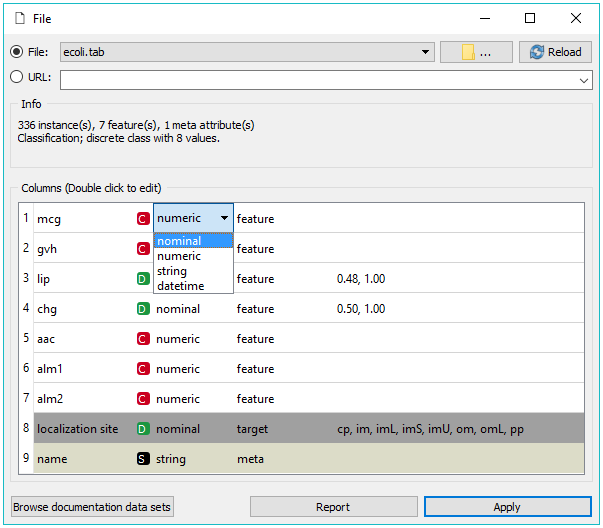
Load and edit your data in the File widget.
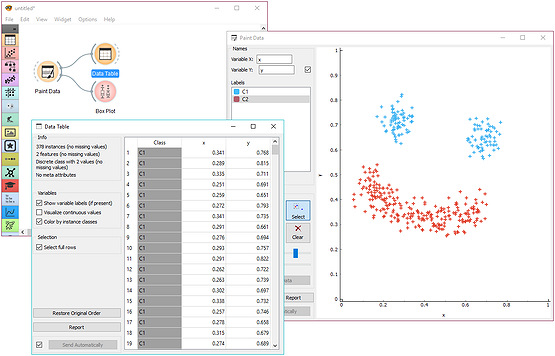
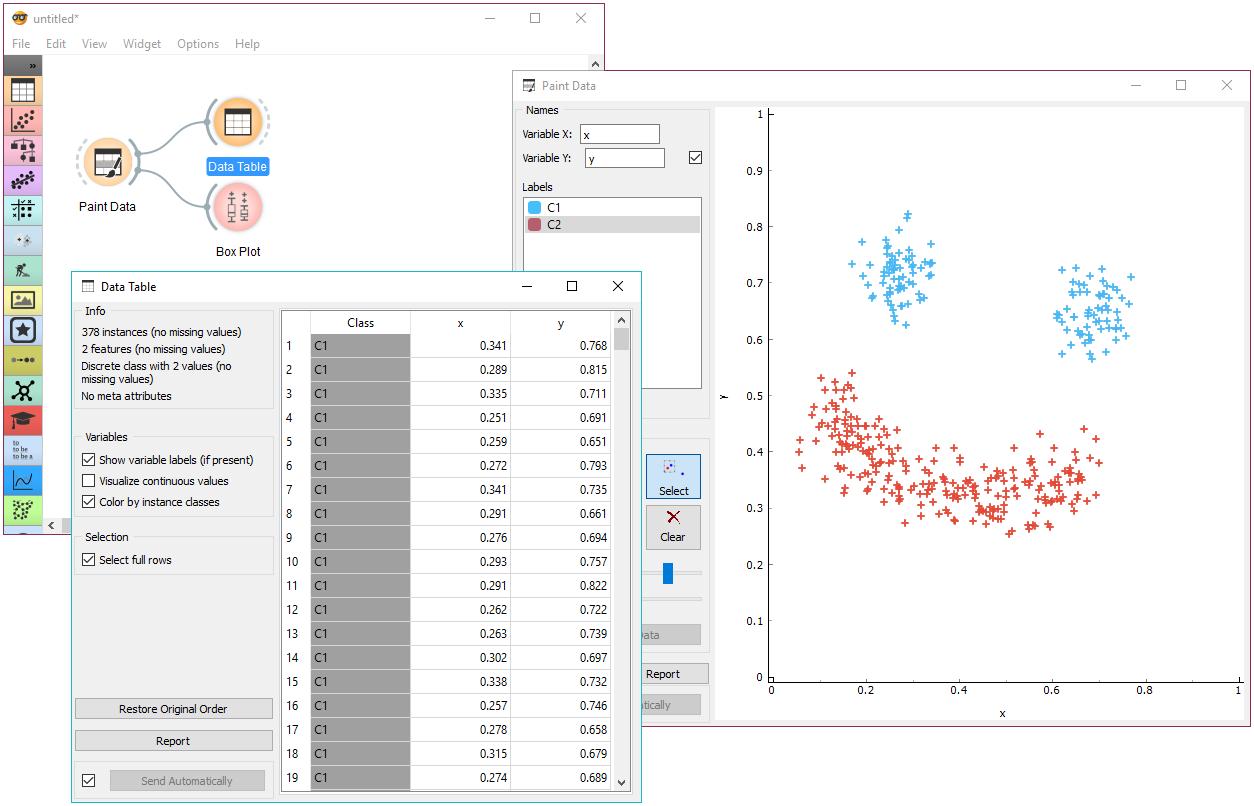
Paint a two-dimensional data set.
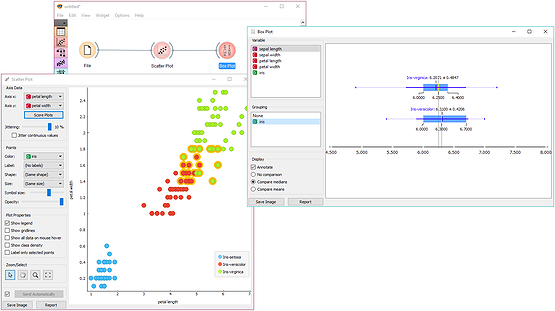
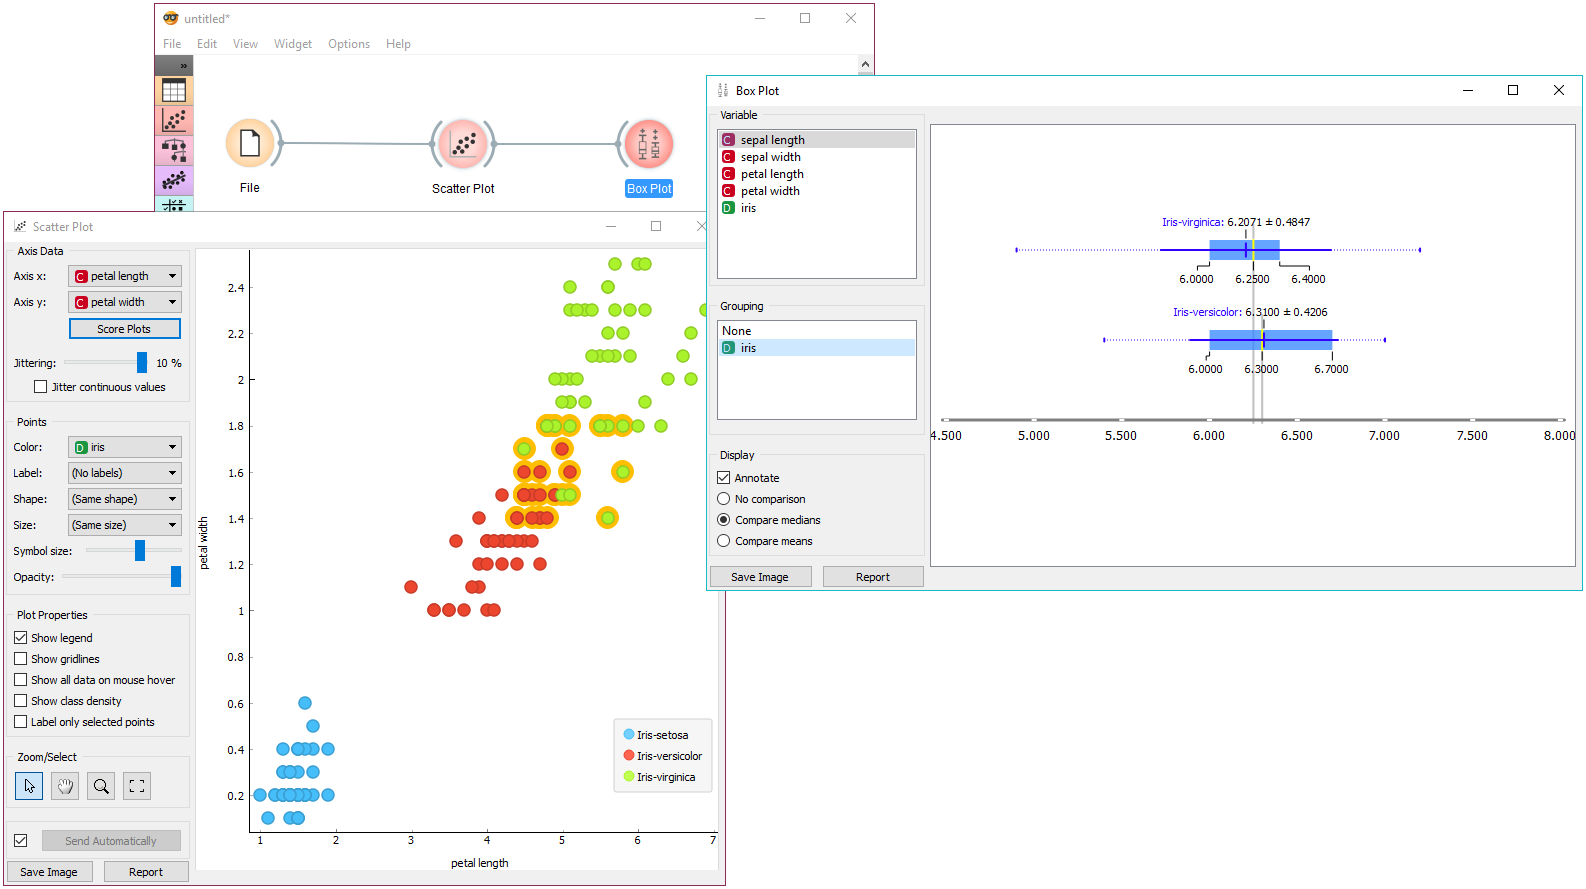
Data selection in Scatter Plot is visualised in a Box Plot.
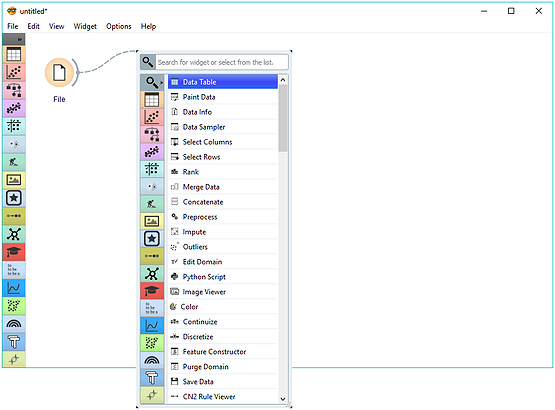
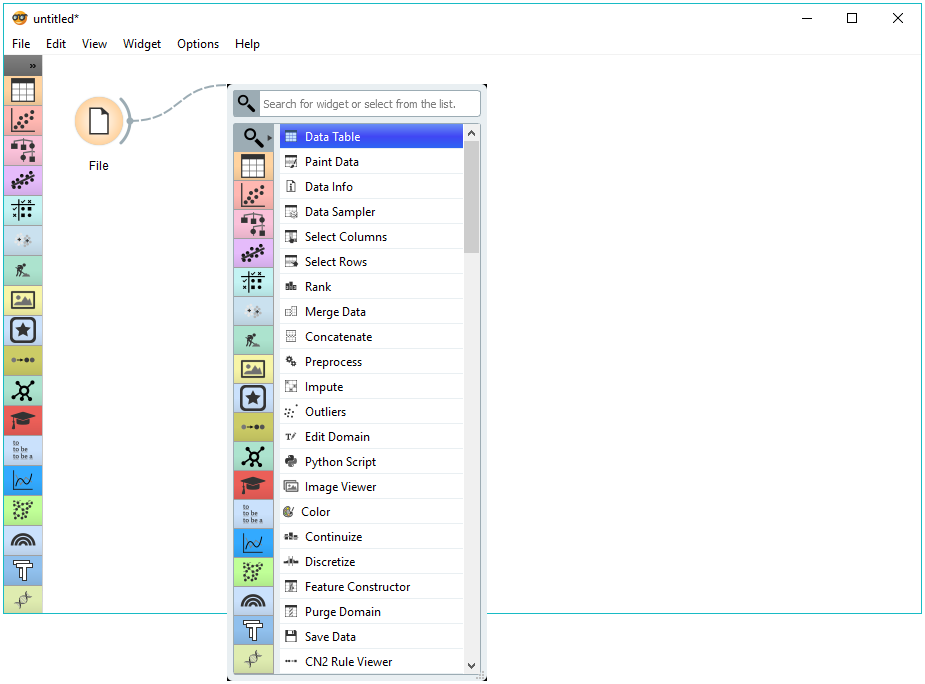
Orange can suggest which widget to add to the workflow.
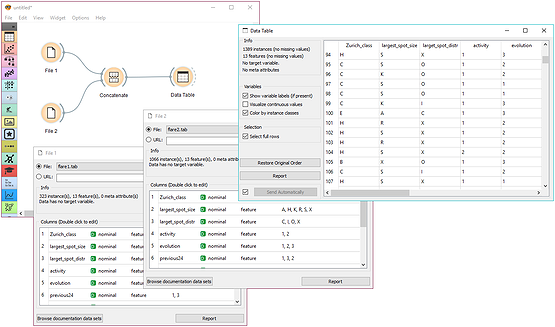
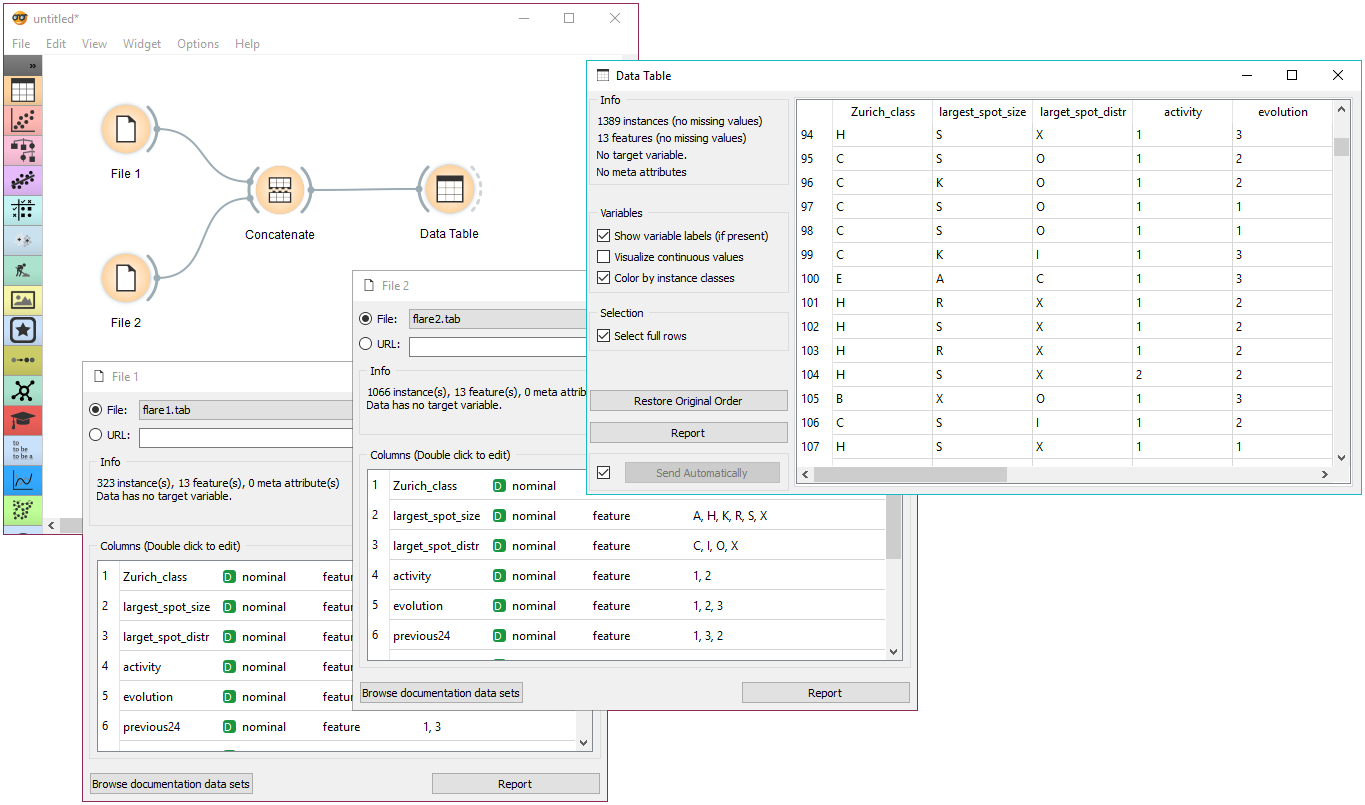
Join two data sets.
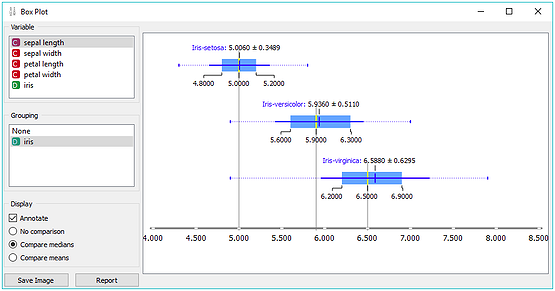
Box plot displays basic statistics of attributes.
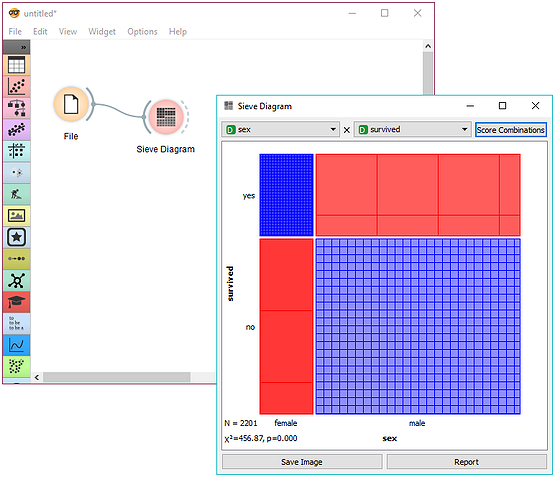
Sieve diagram on Titanic data set.
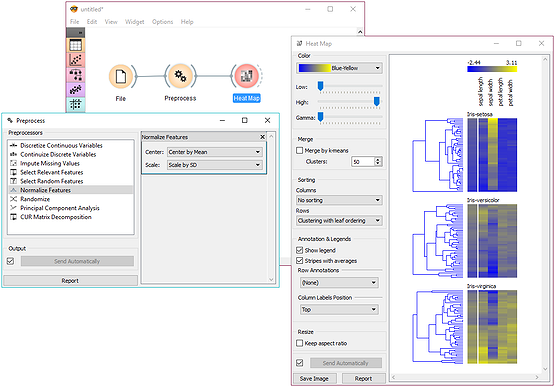
Heatmap visualisation.
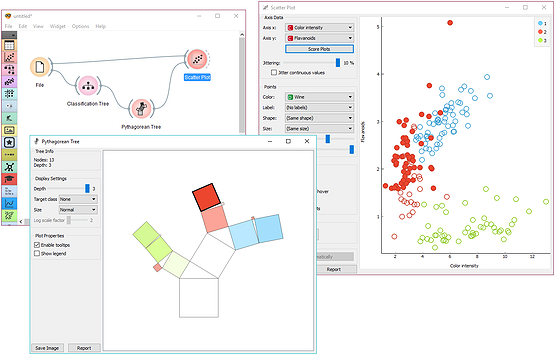
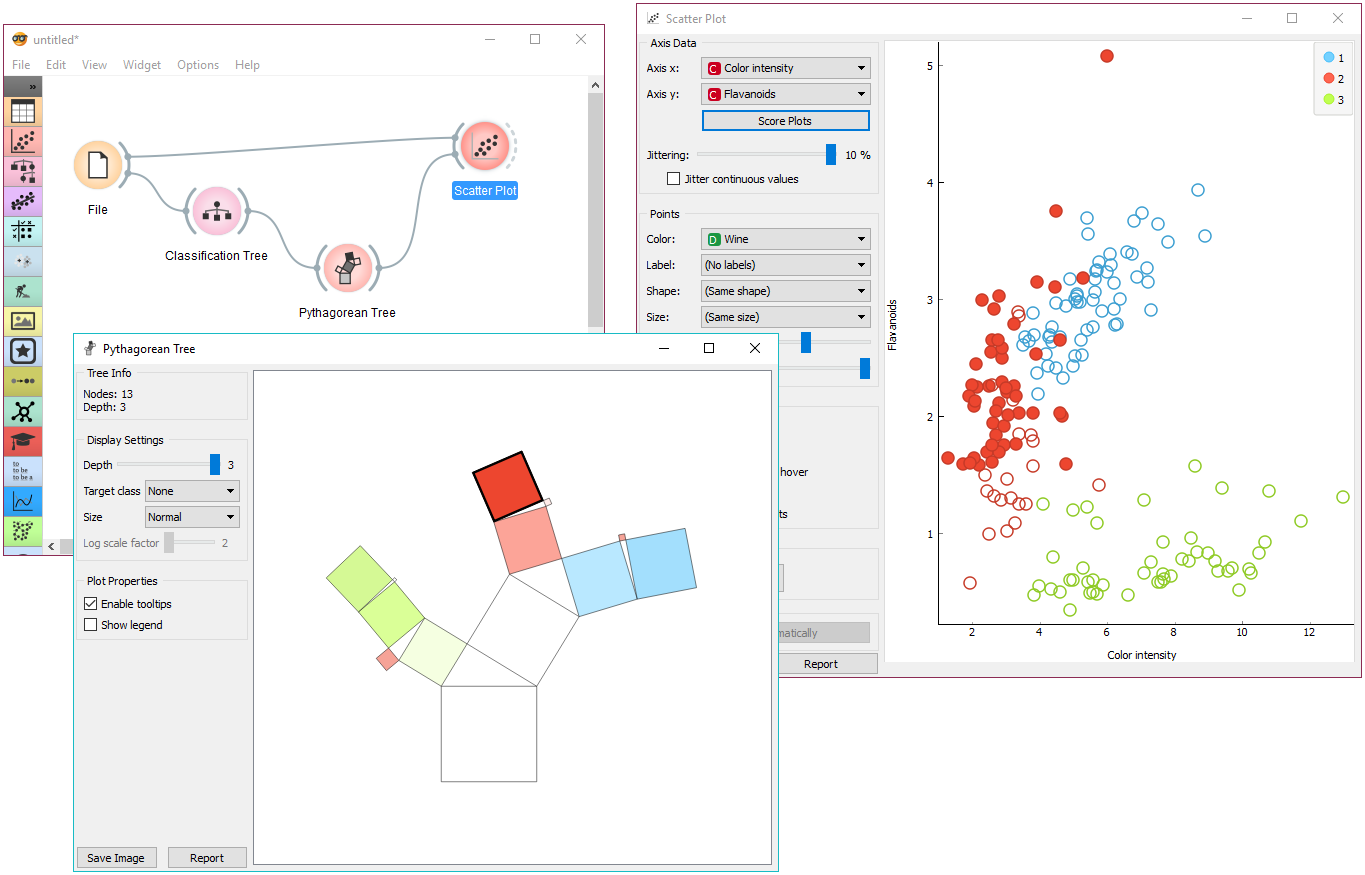
Explorative analysis with classification trees.
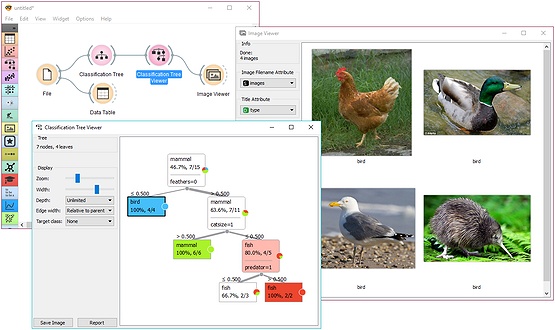
Data can contain references to images.
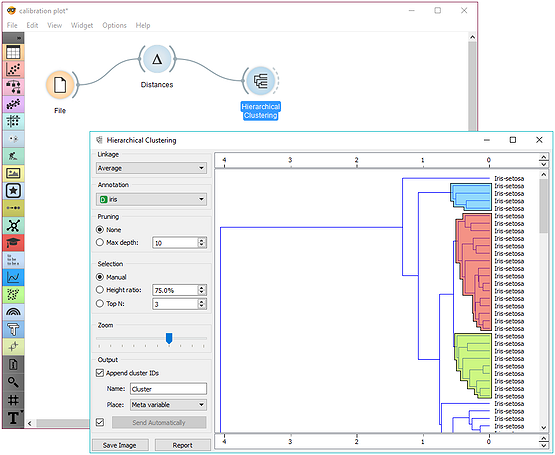
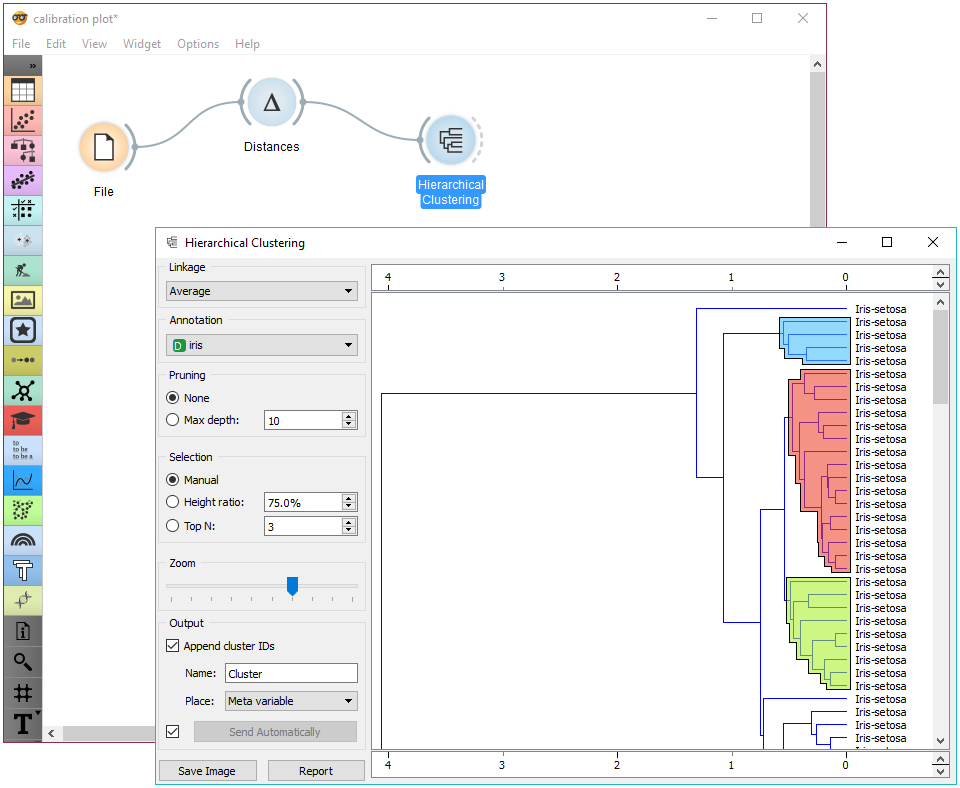
Hierarchial clustering supports interactive cluster selection.
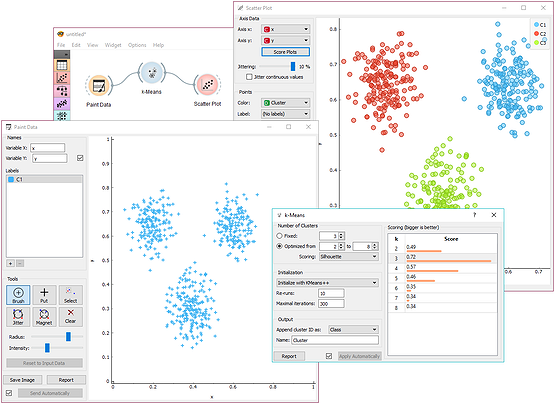
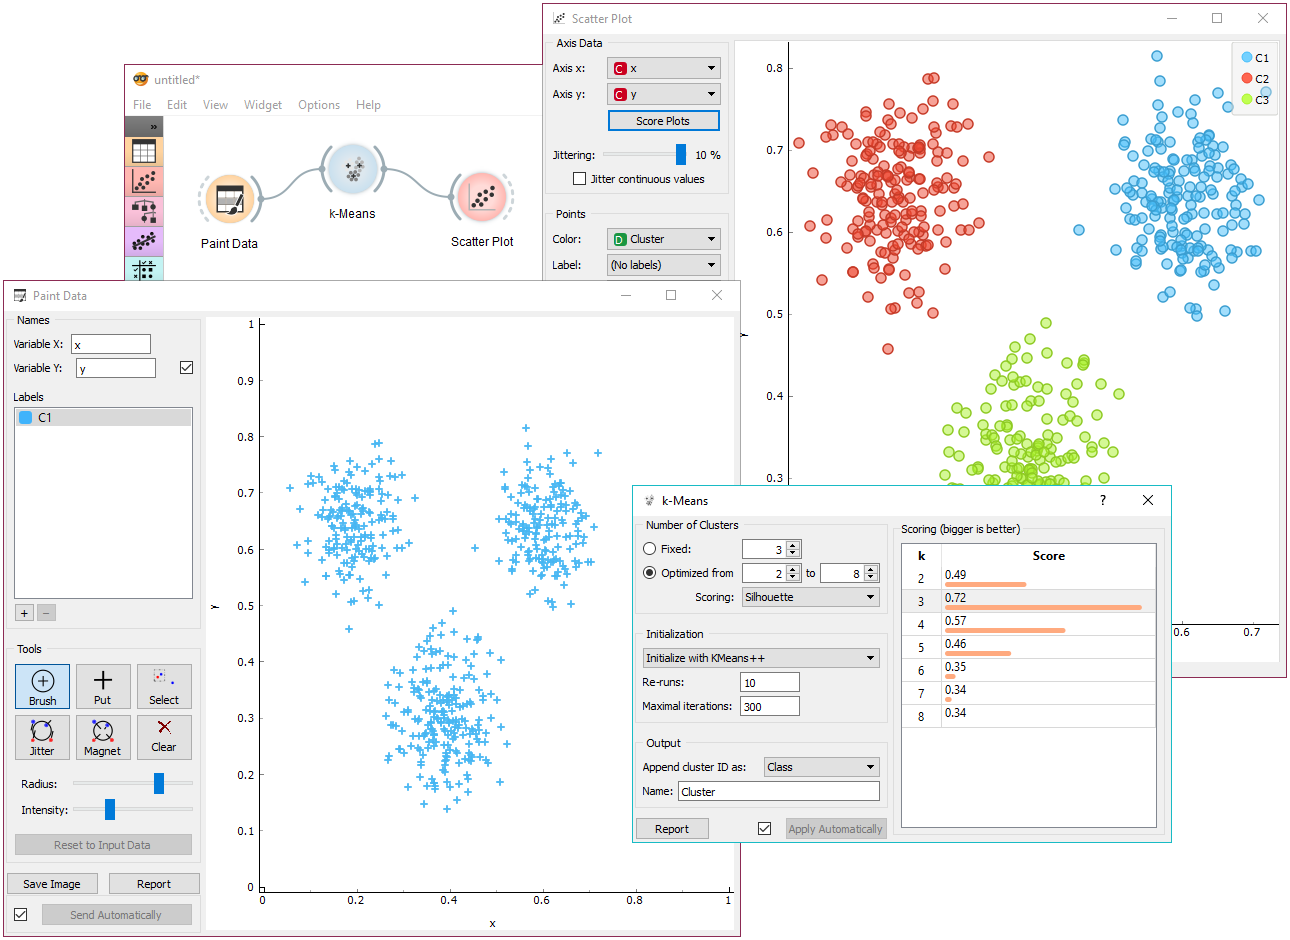
Playing with Paint Data and an automatic selection of clusters in k-Means.
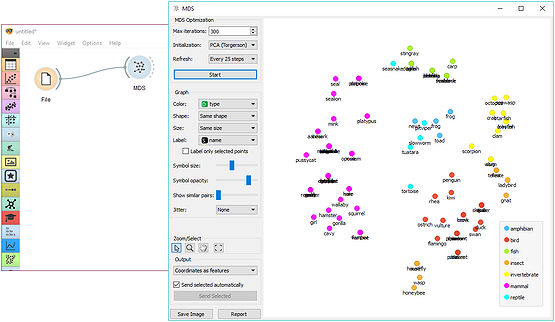
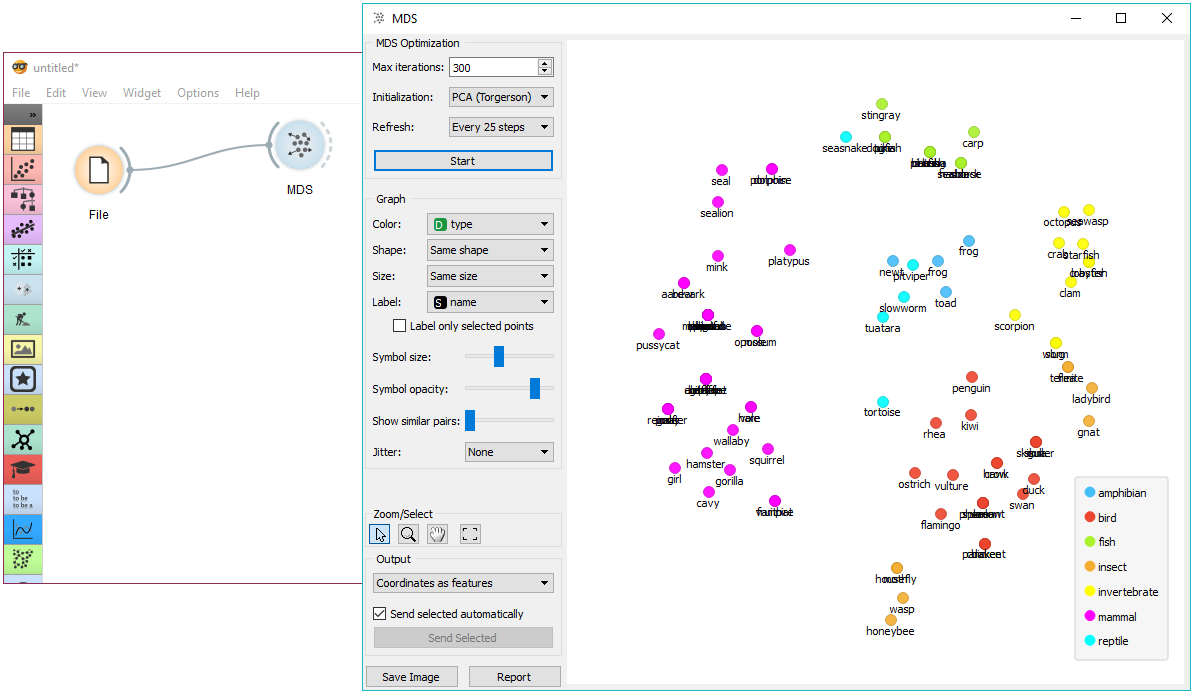
Multidimensional scaling of Zoo data set reveals phylogeny groups.
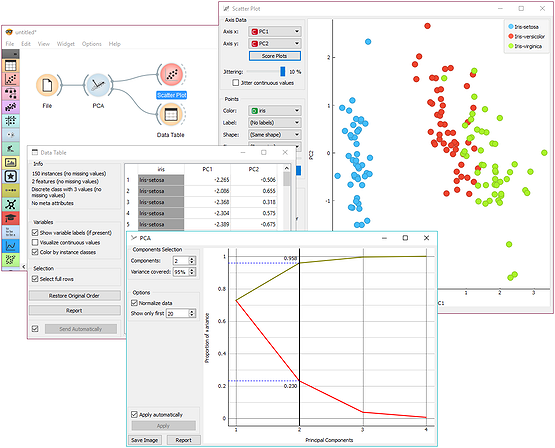
Principal component analysis with scree diagram.
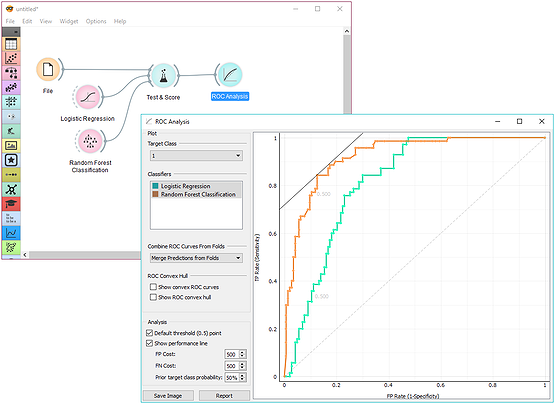
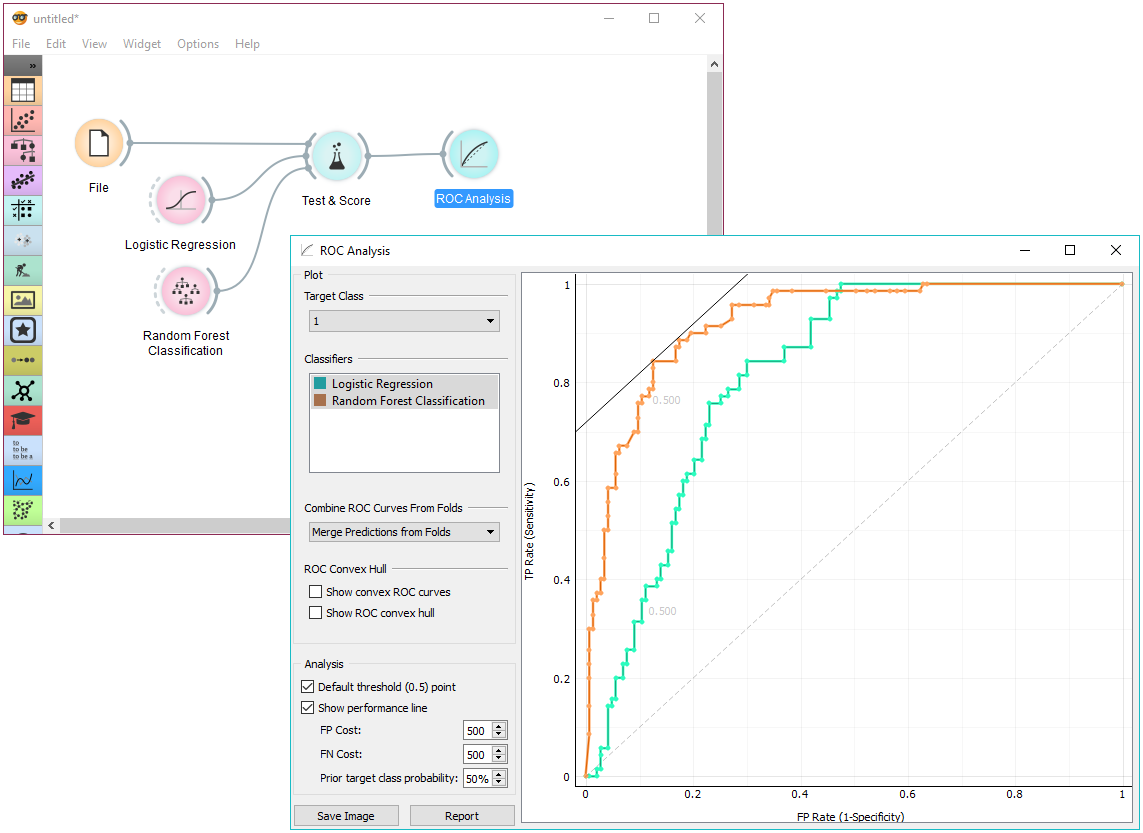
Receiver operating characteristics (ROC) analysis.
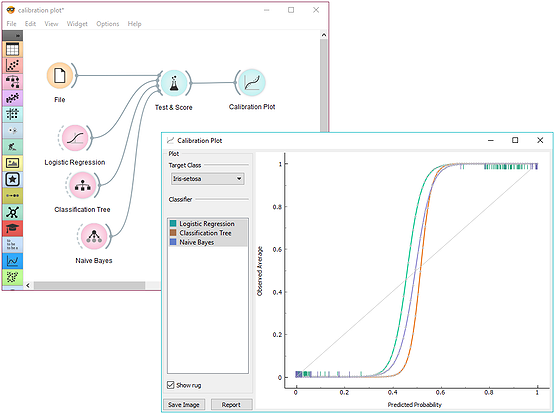
Cross-validated calibration plot.
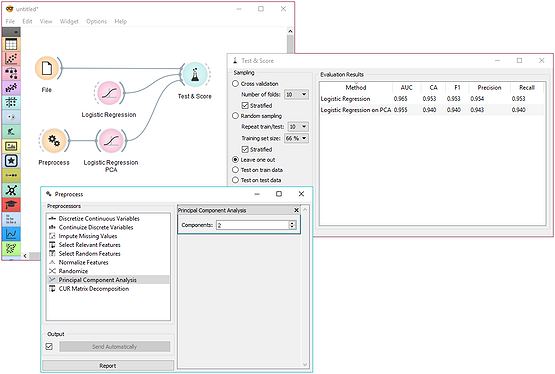
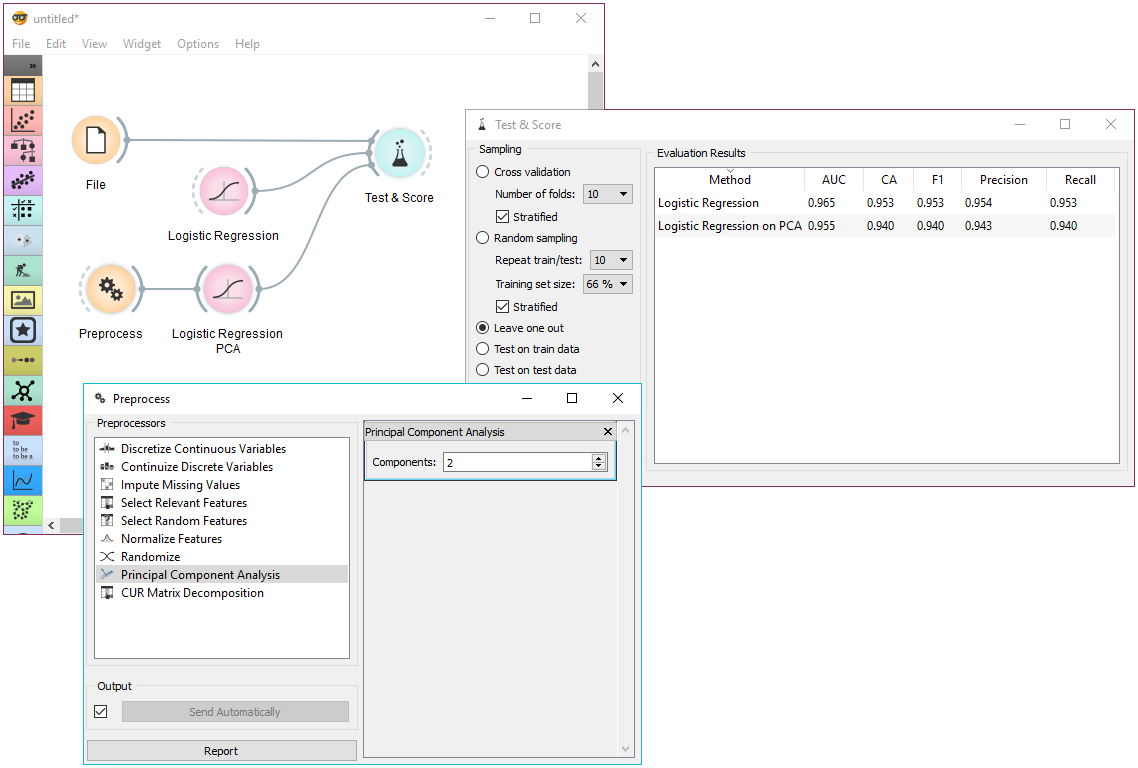
Data preprocessing embedded within a learning algorithm.
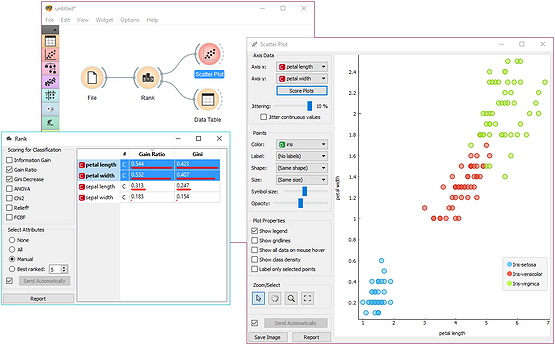
Feature scoring for finding interesting data projections.
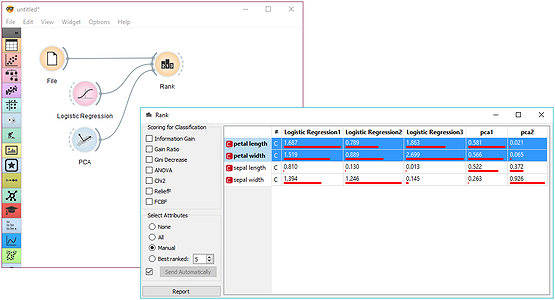
Model-based feature scoring.
Cross-validated calibration plot.
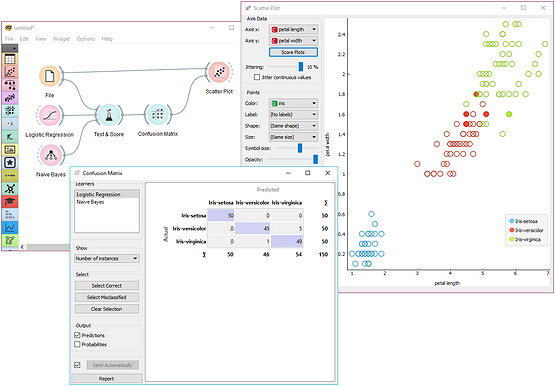
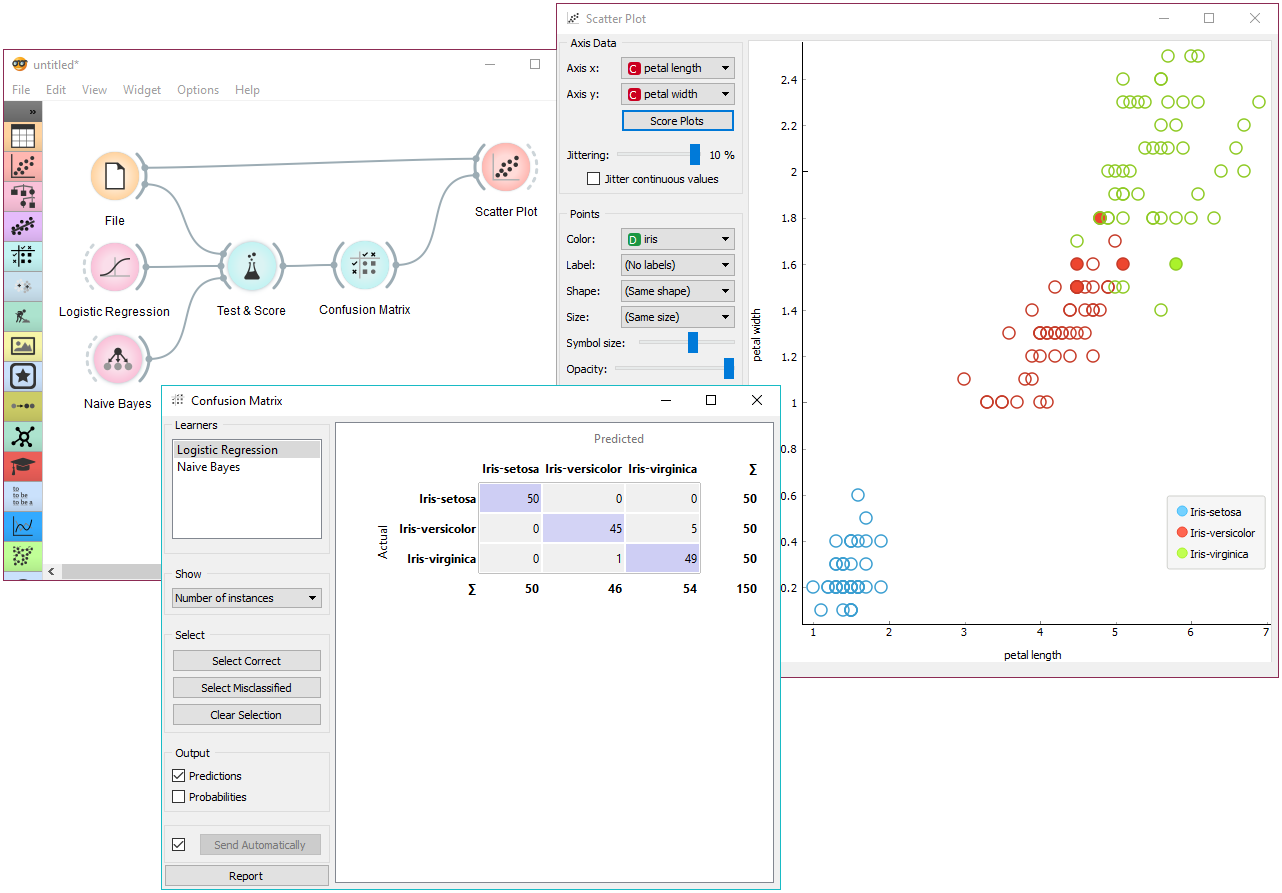
Visualizing misclassifications.
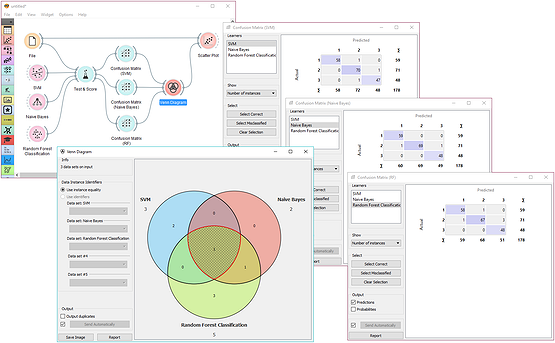
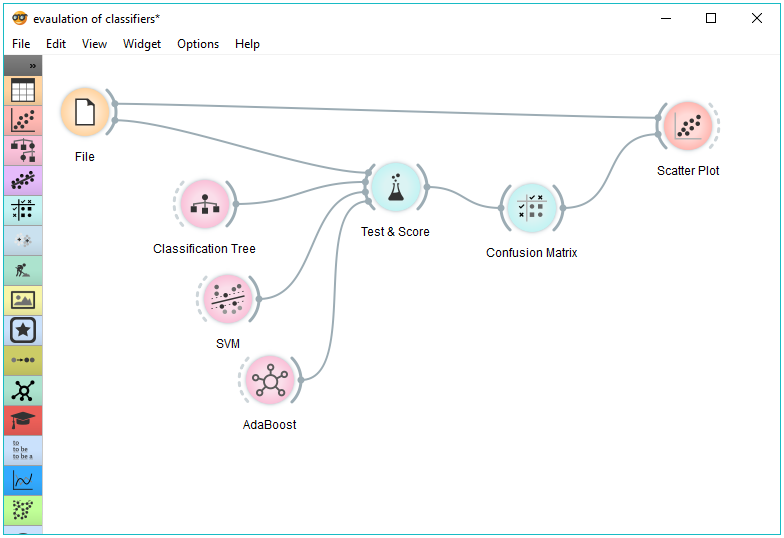
Finding common misclassifications of three predictive models.
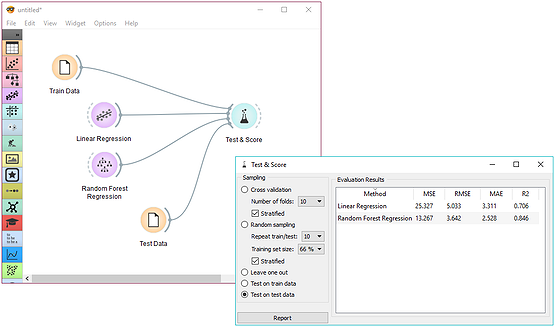
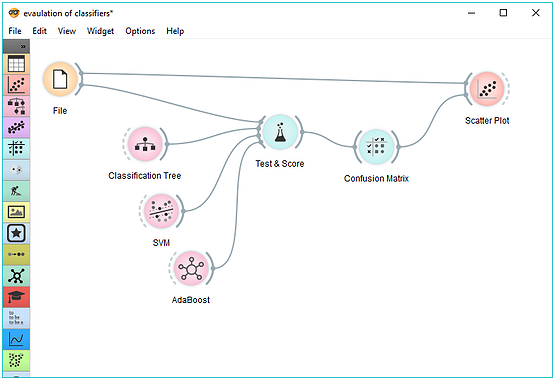
Model testing and scoring on a separate test data set.
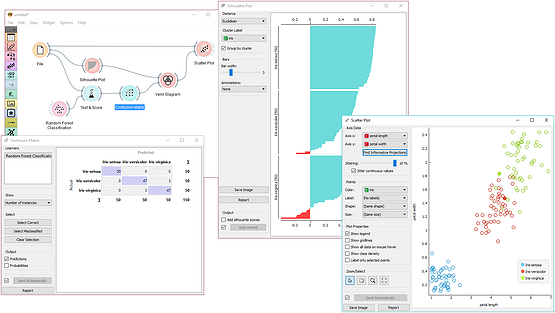
Intersection of misclassified data and data with low silhouette score.
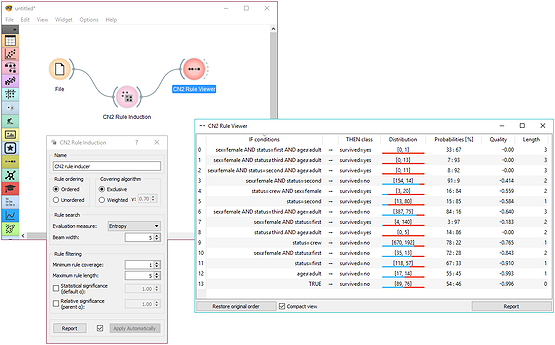
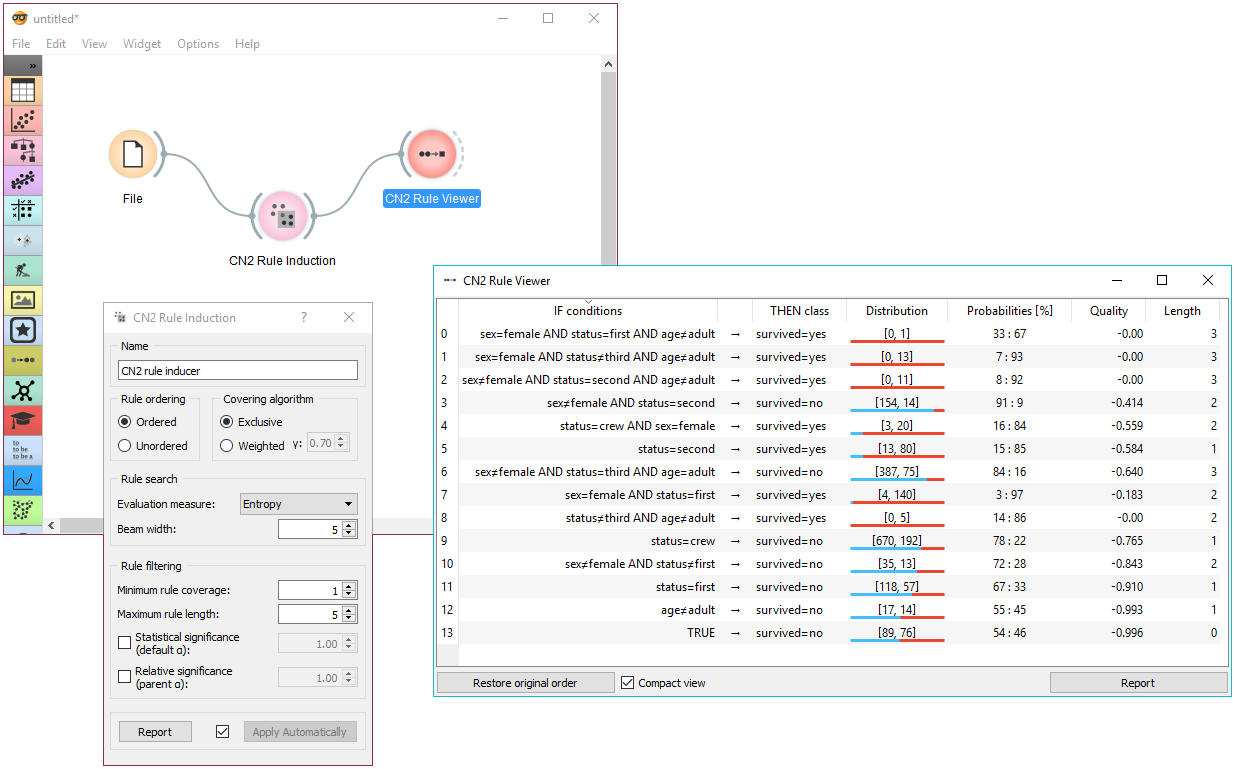
CN2 rule induction.
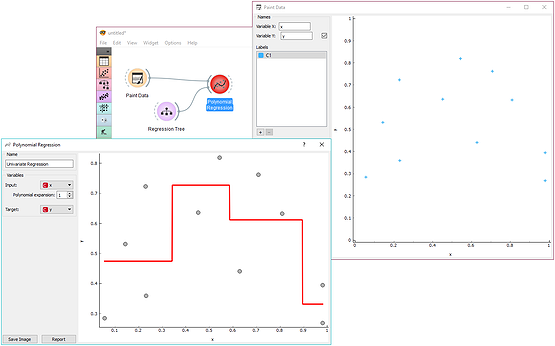
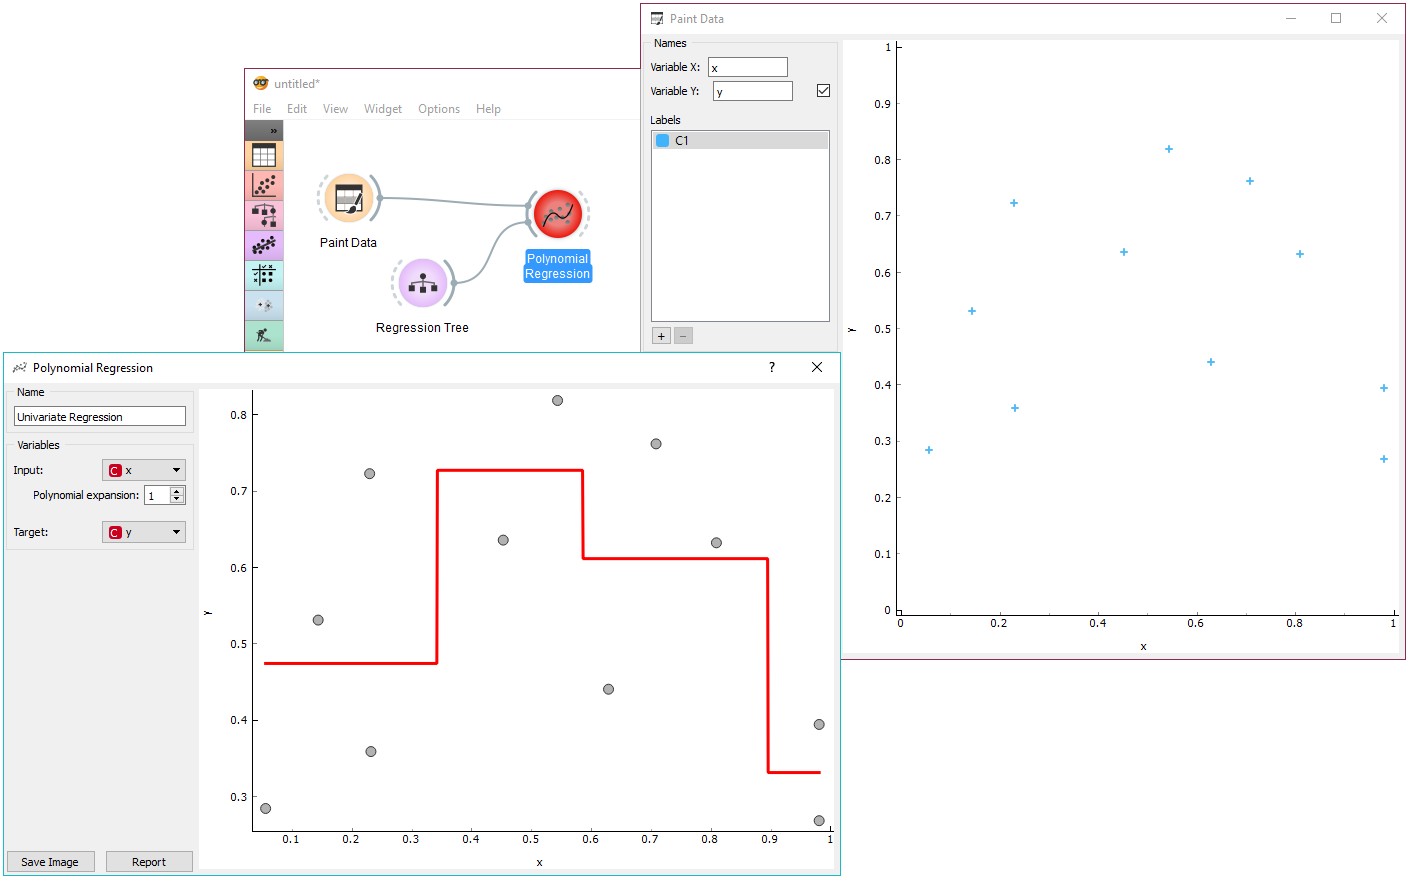
Showcase for approximation by regression tree.
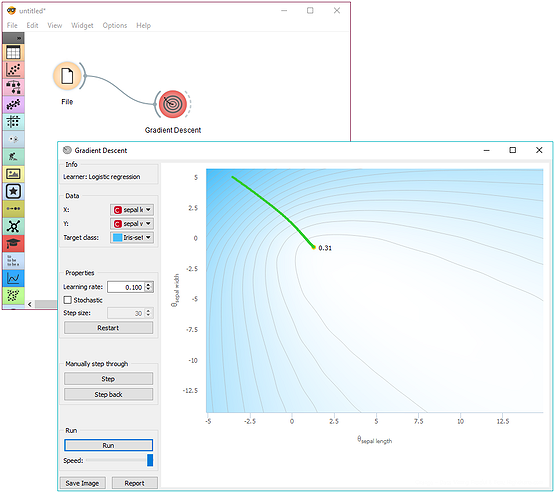
Interactive gradient descent.
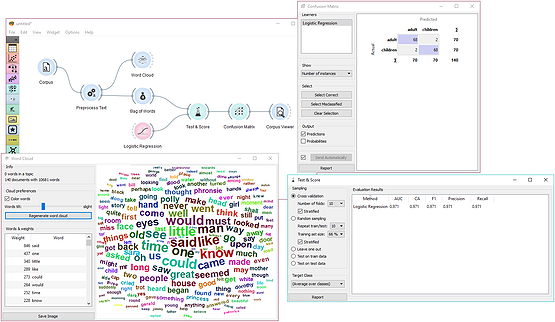
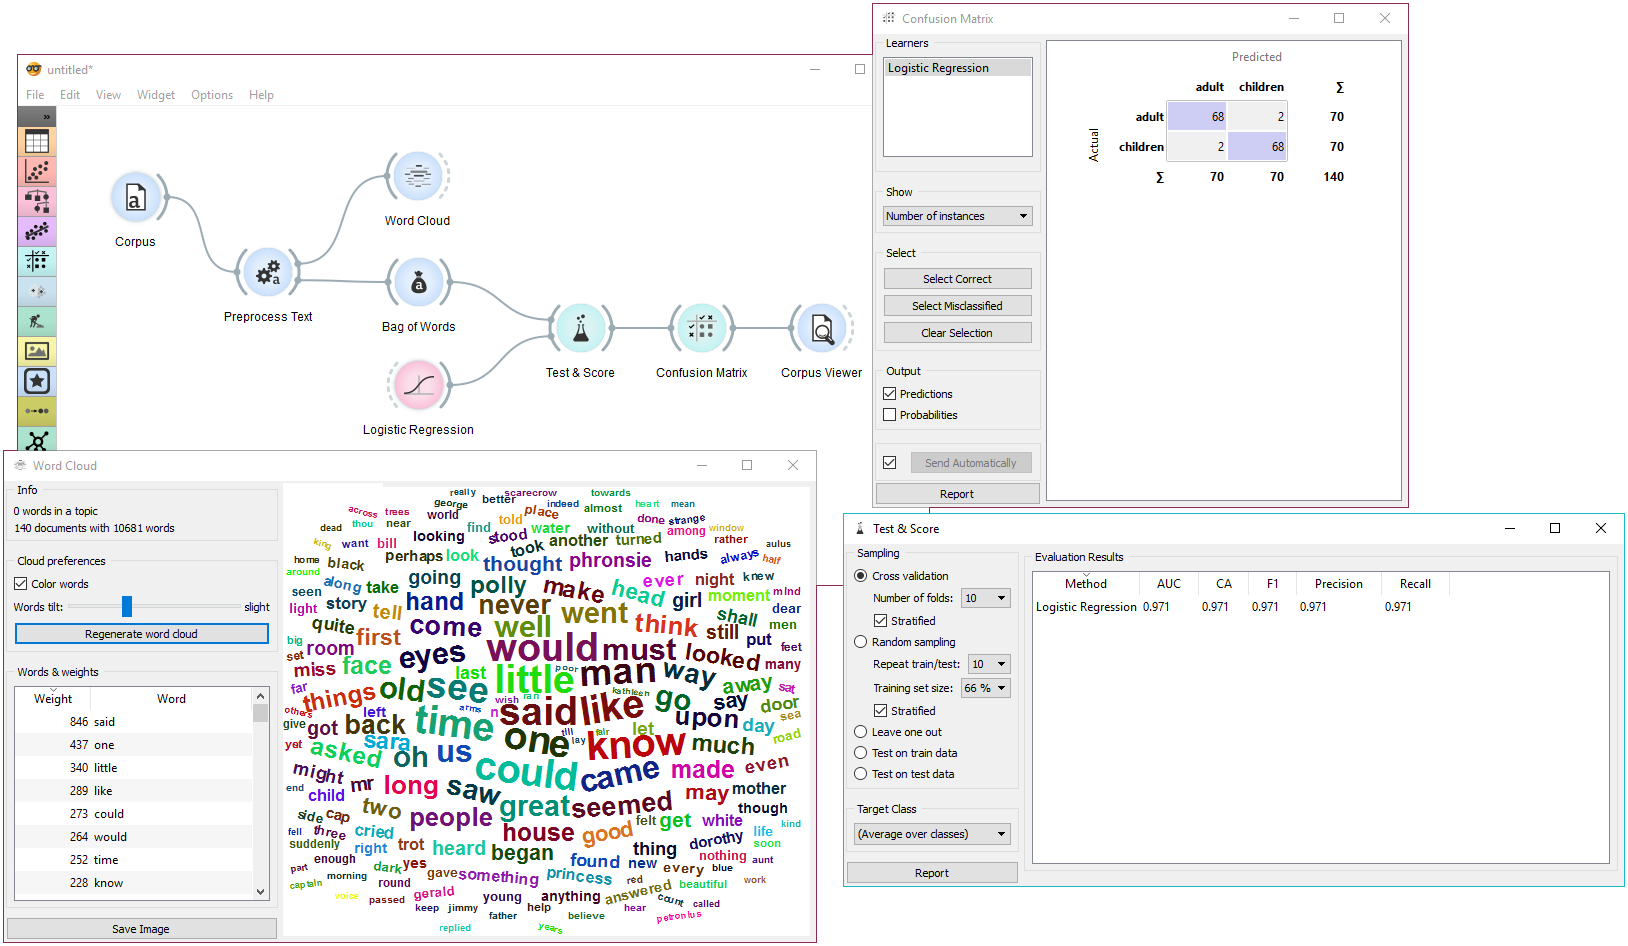
Predicting text categories.
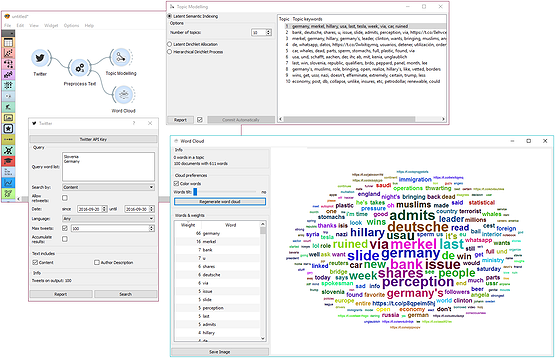
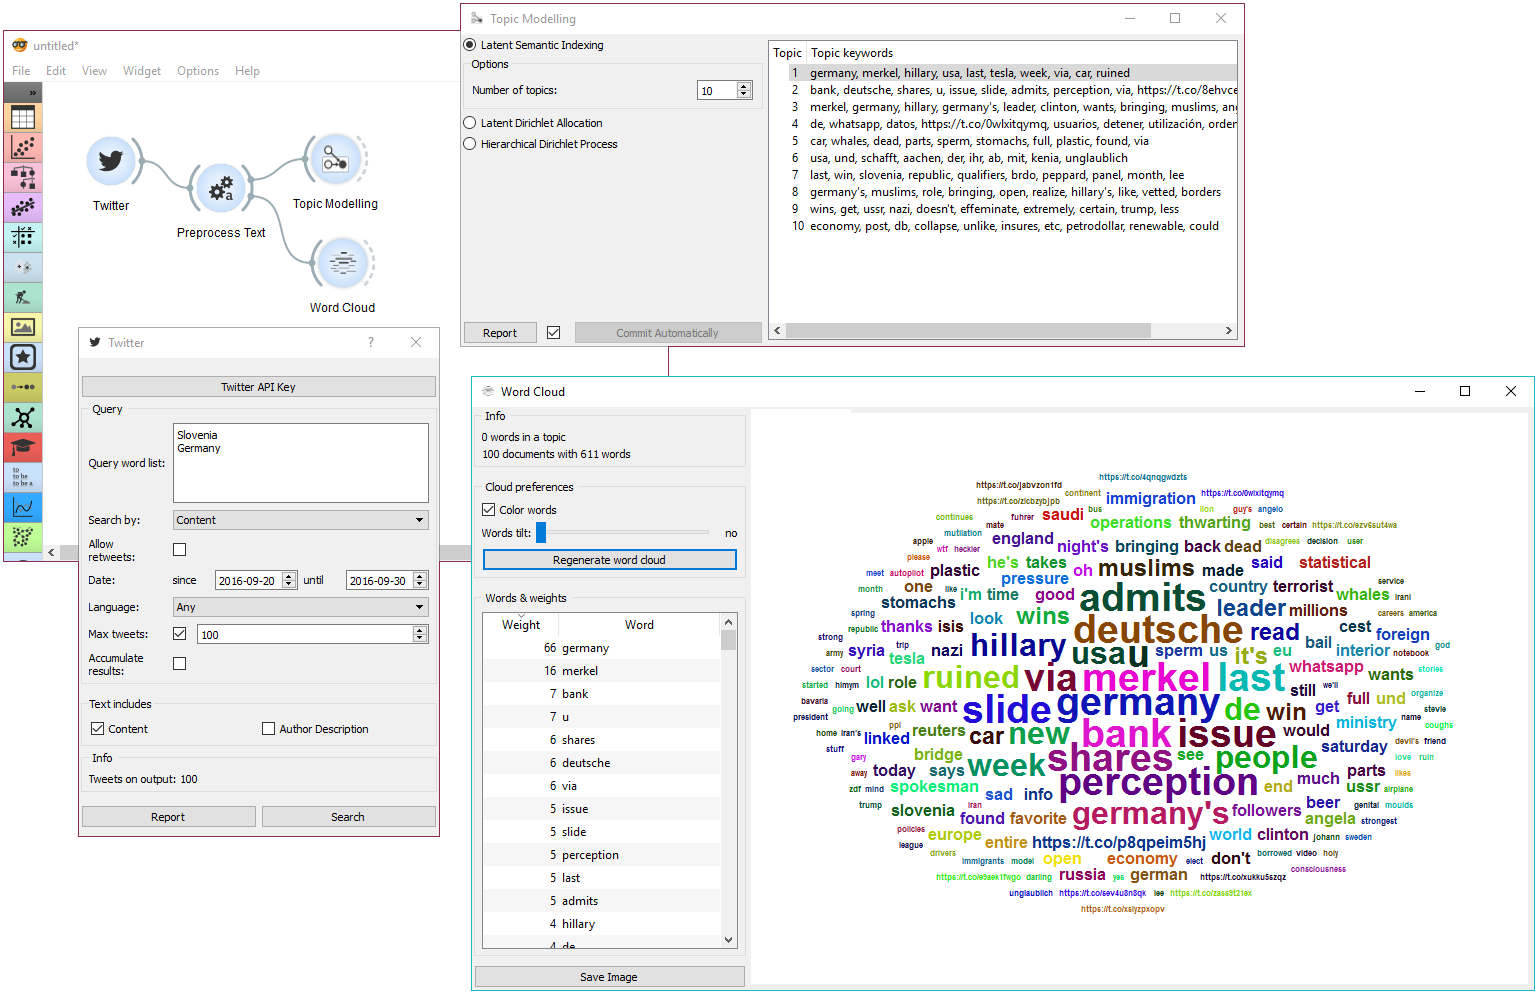
Topic modelling of recent tweets.
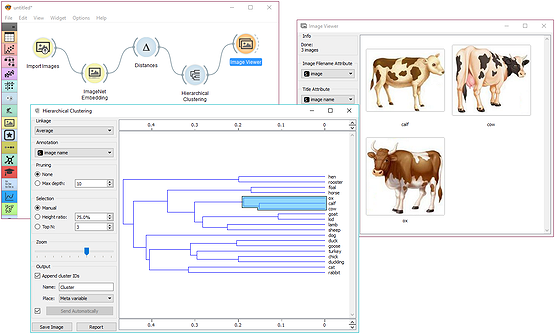
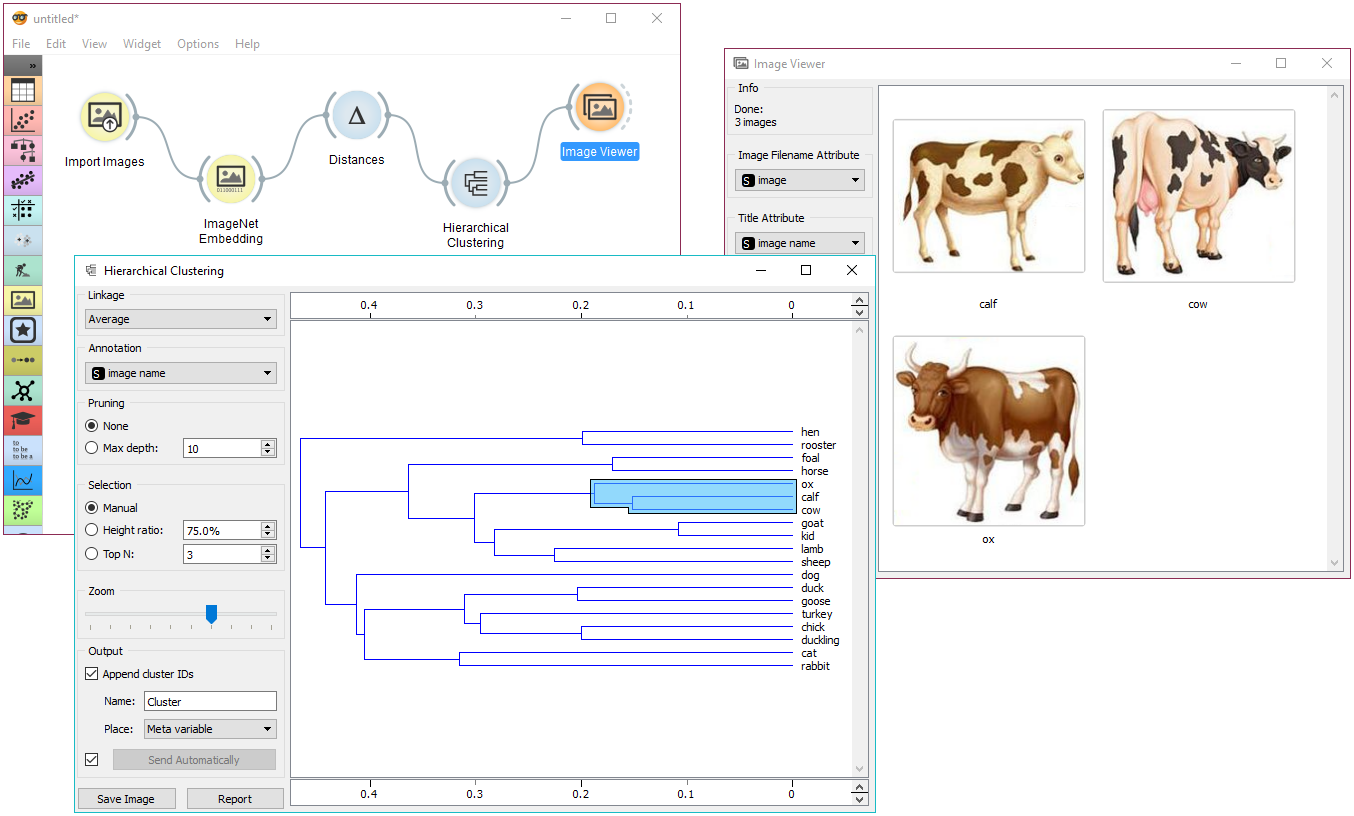
Image analytics with deep-network embedding.