Visual Programming
Orange is a great data mining tool for beginners as well as for expert data scientists. Thanks to its user interface users can focus on data analysis instead on laborious coding, making a construction of complex data analytics pipelines simple.
Component-Based Data Mining
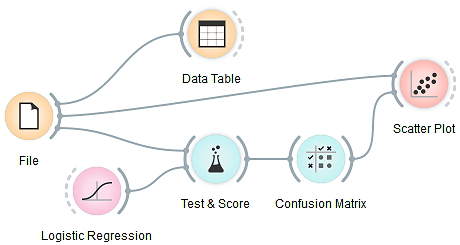
In Orange, data analysis is done by stacking components into workflows. Each component, called a widget, embeds some data retrieval, preprocessing, visualization, modeling or evaluation task. Combining different widgets in a workflow enables you to build comprehensive data analysis schemas as you go. With a large library of widgets you won't be short for choice. Additional widgets are available through add-ons and allow for a more focused and topic-oriented research.
Interactive Data Exploration
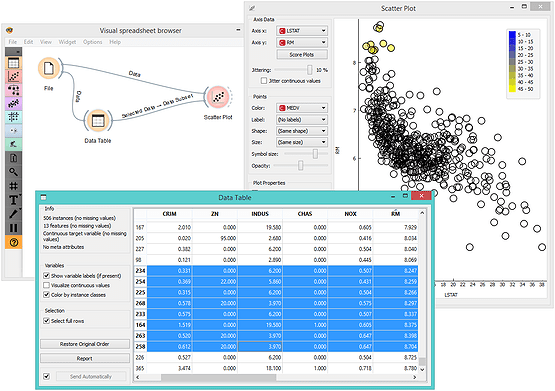
Orange widgets communicate with each other. They receive data on the input and send out filtered or processed data, models, or anything the widget does on the output. Say, start with a File widget that reads the data and connect its output to another widget, say, a Data Table, and you have a functioning workflow. Alter any change in one widget, the changes are instantaneously propagated through the downstream workflow. Changing a data file in the File widget will trigger the response in all downstream widgets. This is especially fun if the widgets are open and when you can immediately see the results of any changes in that data, parameters of the methods or selections in interactive visualizations. For example, in a simple workflow below, where selection of the data in the spreadsheet propagates to a scatter plot, which marks the selected data instances.
\
\
Through the choice of the right widgets and their connections, it is easy to construct complex workflows for a broad variety of data analysis tasks.
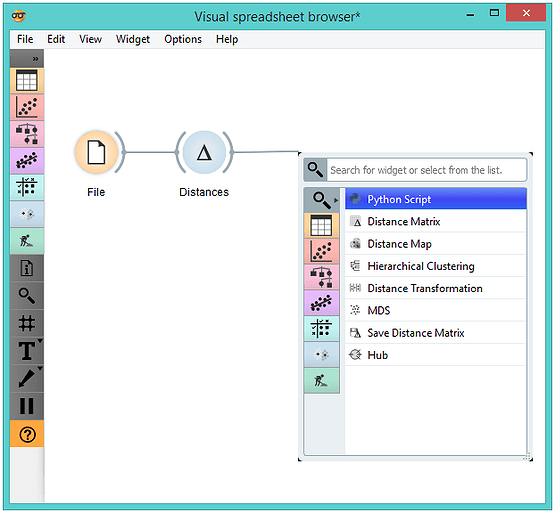
Clever Workflow Design Interface
Orange is easy to use even for complete novices. Start with the File widget and Orange will automatically suggest the next widgets that can be connected to it. For example, Orange knows you are likely to want Hierarchical Clustering after you've set up your Distances widget. All other defaults in the widgets are also set in a way that enables a simple analysis even without knowing a whole lot about statistics, machine learning, or exploratory data mining in general.